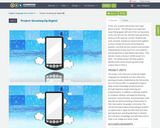
Looking for ways to plan project based learning activities? Suzie Boss suggests …
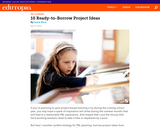
Looking for ways to plan project based learning activities? Suzie Boss suggests borrowing ideas from your colleagues and adapt or remix to fit your context.
Suzie borrowed ideas from professional development and learning conferences for teachers who may need a boost to get their project-based learning off the ground.
In this lesson students will practice accelerating as they run. As they …
In this lesson students will practice accelerating as they run. As they accelerate in the second half of a run, they will notice what changes they make to switch from jogging to sprinting. This activity lets students experience the pleasure of running fast.
In this resource designed for 10th grade, students will work with 15 …
In this resource designed for 10th grade, students will work with 15 different words, building skills in connecting to other vocabulary and understanding connotative meaning.
Play the 1.13 Excel Core 2016 Insert Tab Interface Game. For each …
Play the 1.13 Excel Core 2016 Insert Tab Interface Game. For each term, click on the blue dot on the picture. If you get it wrong, try again. After three tries, the correct dot will turn purple.
This will help you get familiar with the MS Excel 2016 Insert Tab Interface. The link to the game is https://www.purposegames.com/game/2016-excel-113
See if you can identify the different parts of Excel 2016's Insert …
See if you can identify the different parts of Excel 2016's Insert tab! For each term in this interface game, click on the blue dot on the picture. If you get it wrong, try again. After three tries, the correct dot will turn purple.
This game will test your knowledge of the MS Excel 2016 Insert Tab Interface. The link to the game is https://www.purposegames.com/game/2016-excel-113
In lesson 1 of this unit, students will explore what it means …
In lesson 1 of this unit, students will explore what it means to be connected to other people with and without digital technology. They'll also start to consider the ways that their digital connections shape who they are.
Twelve Angry Men is a classic play about the American legal system. …
Twelve Angry Men is a classic play about the American legal system. This lesson introduces students to key ideas they'll need to successfully complete a reading of the play. Students learn about drama terms before they start reading.
Teachers can pick from 12 different ways to approach choreography with their …
Teachers can pick from 12 different ways to approach choreography with their students. Studetns will get an opportunity to explore the creative process with their fellow dancers.
This resource defines sociological imagination and the beliefs and assumptions of functionalism, …
This resource defines sociological imagination and the beliefs and assumptions of functionalism, conflict theory, symbolic interactionism, and exchange theory.
Explore climate and latitude relative to the settlement of the original 13 …
Explore climate and latitude relative to the settlement of the original 13 colonies.
GeoInquiries are designed to be fast and easy-to-use instructional resources that incorporate advanced web mapping technology. Each 15-minute activity in a collection is intended to be presented by the instructor from a single computer/projector classroom arrangement. No installation, fees, or logins are necessary to use these materials and software.
This resource discusses how and why social inequality in the larger society …
This resource discusses how and why social inequality in the larger society manifests itself in higher education, describes the extent of school violence and the controversy over zero-tolerance policies, and describes how schooling in the United States helps perpetuate social inequality.
In this lesson students will read requested information from a phase diagram …
In this lesson students will read requested information from a phase diagram and state the primary difference between a generic phase diagram and a phase diagram of water.
No restrictions on your remixing, redistributing, or making derivative works. Give credit to the author, as required.
Your remixing, redistributing, or making derivatives works comes with some restrictions, including how it is shared.
Your redistributing comes with some restrictions. Do not remix or make derivative works.
Most restrictive license type. Prohibits most uses, sharing, and any changes.
Copyrighted materials, available under Fair Use and the TEACH Act for US-based educators, or other custom arrangements. Go to the resource provider to see their individual restrictions.