In this Khan Academy activity, students will determine the domain of functions.
- Subject:
- Mathematics
- Material Type:
- Activity/Lab
- Provider:
- Khan Academy
- Date Added:
- 08/27/2018

In this Khan Academy activity, students will determine the domain of functions.

Practice determining max and min values from problems.

Editable PPT on using the "X-box" method for factoring a quadratic when the leading coefficient is not 1.

Students collect sample data from their class to estimate the
median foot size of the population of students in the class. Each student obtains a point
estimate and constructs an interval estimate for the median foot size in the entire class by using a
simple random sample of 10 students in the class. Numeric summaries (mean and five-number
summary) and box plots are used to obtain point and interval estimates, respectively, for the
median foot size of the entire class. The teacher records the foot size of all students in class in
order to obtain the population median foot size of the entire class. The confidence level, or
reliability, for the interval estimates computed by the students is estimated by obtaining the
proportion of students' sample interval estimates that trap the population median foot size of the
entire class. In the second part of this activity, students use online statistical software to explore
relationships between both different sample sizes and different shapes of a population
distribution, and the variability in bounds of interval estimates and the intervals’ reliability to
estimate the population median (level of confidence or proportion of sample interval estimates
that trap the population median). Conclusions are drawn about these relationships through
computer simulations using the freely available statistical software SeeIt.

Students will interpret box plots that represent the national median earnings of men and women aged 25 and older whose highest levels of educational attainment are either a high school diploma (or equivalent) or a bachelor's degree. Students will use the box plots to identify each data set's median, maximum, minimum, first quartile, third quartile, range, interquartile range, and outliers. They will also compare the box plots to draw conclusions about differences in earnings between the sexes and between levels of educational attainment.

In this Khan Academy activity, students will factor difference of squares problems.

In this Khan Academy activity, students will factor difference of squares problems.

Texas Instruments lesson comparing the cost of three different scenarios for a dinner party and the significance of slope and y intercept in each situation.

Class activity using distance formula, midpoint formula and cost to plan out a fictional trip

Texas Instruments activity exploring distances in the coordinate plane in order to classify shapes.

This lesson looks back at the graphs students previously studied as an introduction to this module. Students are also asked to interpret what a graph communicates. They are reminded that a graph is not only a representation of data but also a summary of a data story. Each of the graphs presented in the exercises are encountered in the lessons that follow in this module. This lesson asks students to start thinking about what the data indicate, how they might have been collected, and what they tell us.

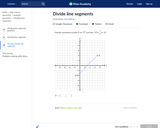
In this Khan Academy activity, students find the coordinates of a third point on a line given the coordinates of the other two.

Texas Instruments activity that uses linear regression specifically to calculate a correlation coefficient.

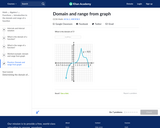
In this Khan Academy activity, students will determine the domain and range of functions from their graph.

This Khan video finds the domain and range of f(x)=3x^2+6x-2.

Practice worksheet with word problems and reasonable domain and range

In this Khan Academy activity, students will practice finding the domain of advanced functions.

In this Khan Academy activity, students will practice finding the domain of advanced piecewise functions.

Texas Instruments activity with exponential growth where a tree doubles in growth every year.

Students will develop, justify, and evaluate conjectures about the relationship between two quantitative variables over time in the United States: the median age (in years) when women first marry and the percentage of women aged 25-34 with a bachelor's degree or higher.