
Practice worksheet that would work well as an assessment on midpoint and distance give endpoints.
- Subject:
- Mathematics
- Material Type:
- Activity/Lab
- Provider:
- Matanuska-Susitna Borough School District
- Date Added:
- 05/01/2018

Practice worksheet that would work well as an assessment on midpoint and distance give endpoints.
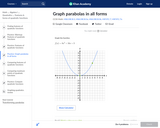
In this Khan Academy activity, students will graph a parabola given any form,
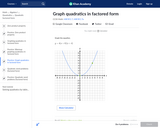
In this Khan Academy activity, students will graph a parabola given its factored form.
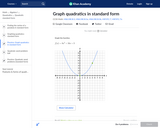
In this Khan Academy activity, students will graph a parabola given its standard form.
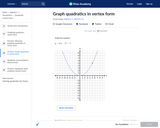
In this Khan Academy activity, students will graph a parabola given its vertex form.
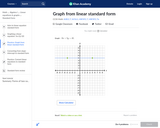
In this Khan Academy activity, students will graph a line from its standard form.
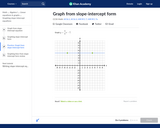
In this Khan Academy activity, students will graph a line from its slope-intercept form.

Class activity that compares exponential equations and their tables and graphs.
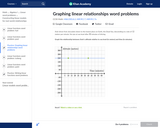
In this Khan Academy activity, students will graph a line from a word problem.

Students relate the solutions of a quadratic equation in one variable to the zeros of the function it defines. They sketch graphs of quadratic functions from tables, expressions, and verbal descriptions of relationships in real-world contexts, identifying key features of the quadratic functions from their graphs. Students also graph and show the intercepts and minimum or maximum point.

Students graph a variety of quadratic functions using the form () = ^2 + + (standard form) and analyze and draw conclusions about contextual applications using the key features of a function and its graph.

Students represent graphically a nonlinear relationship between two quantities and interpret features of the graph. They understand the relationship between physical quantities via the graph.
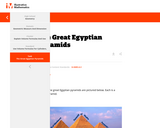
The task involves either finding the volume of a pyramid or using the volume to find the base or height. This task requires students to rearrange the volume formula for a square pyramid to highlight the relevant quantity (volume, base and height).

Four guided problems for teachers and students to work through in context.
Texas Instruments activity where students will create equations with two or more variables to represent relationships between quantities. They will also graph equations on coordinate axes with labels and scales.

SAT prep unit on systems of equations and inequalities'

The purpose of this task is to assess understanding of how study design dictates whether a conclusion of causation is warranted. This study was observational and not an experiment, which means that it is not possible to reach a cause-and-effect conclusion.
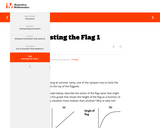
Students are given a scenario and different graphs that could describe the relationship of the quantities in the situation, the height of a flag as a function of time. The scenario is open ended enough, so that most of the graphs could fit the situation.
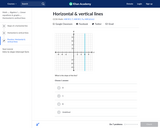
In this Khan Academy activity, students will construct and graph vertical and horizontal lines.

This task a could be used as an introduction to writing and graphing linear inequalities.