Students explore the methods scientists use to survey elephants and learn about …
Students explore the methods scientists use to survey elephants and learn about the current state of the elephant population in Africa. The story of African elephants is a powerful case study of how science can inform conservation. It is important to track how many elephants are left and where they live to help protect them.
This series of activities complements the HHMI DVD Evolution: Constant Change and …
This series of activities complements the HHMI DVD Evolution: Constant Change and Common Threads, and requires simple materials such as M&Ms, food storage bags, colored pencils, and paper cups. An extension of this activity allows students to model Hardy-Weinberg and selection using an Excel spreadsheet. This part of the activity requires computer/printer access. The overall goal of Battling Beetles is to engage students in thinking about the mechanism of natural selection through data collection and pattern recognition.
This series of hands-on activities complements the HHMI DVD Evolution: Constant Change …
This series of hands-on activities complements the HHMI DVD Evolution: Constant Change and Common Threads, and requires simple materials such as M&Ms, food storage bags, colored pencils, and paper cups. This activity has been designed to engage students in thinking about the mechanism of natural selection by encouraging them to formulate questions that can be answered through scientific investigation, data collection, and pattern recognition.
This activity accompanies the Scientists at Work video Genetically Modified Mosquitoes. The …
This activity accompanies the Scientists at Work video Genetically Modified Mosquitoes. The video describes how scientists at the company Oxitec produced a line of genetically modified (GM) mosquitoes that, when released into the wild, would reduce local mosquito populations. In this activity, students are challenged to provide their own questions and ideas for experiments they could conduct to investigate the impact of releasing GM mosquitoes into the wild. The students then learn the approaches that scientists at Oxitec have used to conduct such experiments, and use math, descriptive statistics, and line and bar graphs to analyze their data from treatment and control areas. As an option, students may also use spreadsheets to analyze and graph the data.
In this activity, students analyze a graph of carbon dioxide concentrations at …
In this activity, students analyze a graph of carbon dioxide concentrations at Mauna Loa Observatory and answer a series of questions based on the graph.
This lesson complements the film The Biology of Skin Color and discusses …
This lesson complements the film The Biology of Skin Color and discusses variation in human skin color and polygenic inheritance. In Part 1 of this activity, a simple mathematical model illustrates an idealized relationship between the number of genes involved in a trait and the number of phenotypes derived from the combination of alleles. In Part 2, students learn about the methods by which geneticists identify skin-color genes and estimate heritability. Finally, in Part 3, students learn how geneticists analyze genetic variations to trace an individual’s ancestry. Students draw conclusions about the predominant ancestry of two different individuals by comparing their genetic profiles against real allele frequency data.
Students sort lizards by appearances, then generate a phylogenetic tree using the …
Students sort lizards by appearances, then generate a phylogenetic tree using the lizards' DNA sequences to evaluate whether species that appear similar are closely related to each other.
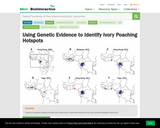
In this activity, students examine a series of maps showing the locations …
In this activity, students examine a series of maps showing the locations where forest elephants were likely poached, based on genetic evidence from ivory seizures. A series of questions is provided to guide a class discussion on the graph characteristics and what the data show.
This animation illustrates how a single virus can infect a cell, replicate, …
This animation illustrates how a single virus can infect a cell, replicate, and give rise to many progeny viruses that can then infect many neighboring cells.
This activity is part of a series of activities and demonstrations focusing …
This activity is part of a series of activities and demonstrations focusing on various aspects of the human immunodeficiency virus (HIV) life cycle. Students will explore an interactive that discusses some of the characteristics of viruses. They will then observe two demonstrations that illustrate how viruses exit cells. Enveloped viruses exit a cell by budding, taking the host cell membrane with them. In the first demonstration, this process is shown using a plastic bag filled with Styrofoam balls or Ping Pong balls. Nonenveloped viruses exit an infected cell by lysis, or by bursting out of and destroying the infected cell. In the second demonstration, this process is shown using a balloon filled with bits of paper.
In this video lecture series, two leading researchers explain how they use …
In this video lecture series, two leading researchers explain how they use both simple and sophisticated technologies to detect and fight infectious agents.
With this interactive resource, students can explore the similarities and differences of …
With this interactive resource, students can explore the similarities and differences of a variety of viruses by sorting them based on structure, genomic make-up, host range, transmission mechanism, and vaccine availability.
This video shows how scientists in Bangladesh are testing fruit bat populations …
This video shows how scientists in Bangladesh are testing fruit bat populations to determine whether they are infected with Nipah virus - a potentially deadly virus when passed on to humans.
Students will make observations and measurements on photomicrographs of research samples of …
Students will make observations and measurements on photomicrographs of research samples of fossilized protists called foraminifera (or forams). Their observations mirror those made by researchers documenting a mass extinction event at the end of the Cretaceous period about 66 million years ago. This activity complements the hands-on activity Weighing the Evidence for a Mass Extinction - On Land, in which students analyze graphs and examine data on pollen gains and fern spores to form a picture of the living landscape before and sfter the K-t mass extinction. This hands-on activity supports the HHMI short film The Day the Mesozoic Died, and in particular Act 1: An Earth-Shattering Hypothesis.
No restrictions on your remixing, redistributing, or making derivative works. Give credit to the author, as required.
Your remixing, redistributing, or making derivatives works comes with some restrictions, including how it is shared.
Your redistributing comes with some restrictions. Do not remix or make derivative works.
Most restrictive license type. Prohibits most uses, sharing, and any changes.
Copyrighted materials, available under Fair Use and the TEACH Act for US-based educators, or other custom arrangements. Go to the resource provider to see their individual restrictions.