- Author:
- Carrie Robledo
- Subject:
- Mathematics
- Material Type:
- Activity/Lab
- Level:
- Middle School
- Tags:
- License:
- Creative Commons Attribution Non-Commercial
- Language:
- English
Education Standards
3695177_TestBooklet
Project 4 Unit Rate and Decimals Exit Ticket
6th Grade Math - Unit Rates and Calculating Decimals

Overview
Students will create a map that includes (at minimum) five quadrilateral buildings, one must be the post office. They will use the spheros to find the best route from the post office to each of the buildings, in the shortest amount of time. Students will need to find the total amount of time it takes the mailman to deliver the mail to each building. Determine how much he would get paid per hour if he received $100 to complete the route. |
Instructor Directions
Finding Unit Rates and Calculating Decimals
| Driving Question / Scenario | How do you accurately calculate the unit rate and perform multiple operations with decimals? |
| Project Summary | Students will create a map that includes (at minimum) five quadrilateral buildings, one must be the post office. They will use the spheros to find the best route from the post office to each of the buildings, in the shortest amount of time. Students will need to find the total amount of time it takes the mailman to deliver the mail to each building. Determine how much he would get paid per hour if he received $100 to complete the route. |
| Estimated Time | 120 minutes or less if the students use maps from project 3. |
| Materials / Resources | Pencils, loose leaf paper (for calculations), calculators (at teacher’s discretion), set of directions, large chart paper, spheros, tablets, colored pencils or crayons and rulers.(10-20 mins) Teacher will introduce the concept of ratios and unit rate/price. |
| Standards | 6.RP. 2 - Understand that ratios can be expressed as equivalent unit ratios by finding and interpreting both unit ratios in context. 6.NS.3- Apply and extend previous understandings of decimals to develop and fluently use the standard algorithms for addition, subtraction, multiplication and division of decimals. 6.G.2.1- Use maps, charts, graphs, geographic data, and available technology tools to draw conclusions about the emergence, expansion, and decline of civilizations, societies, and regions. |
| Project Outline | |
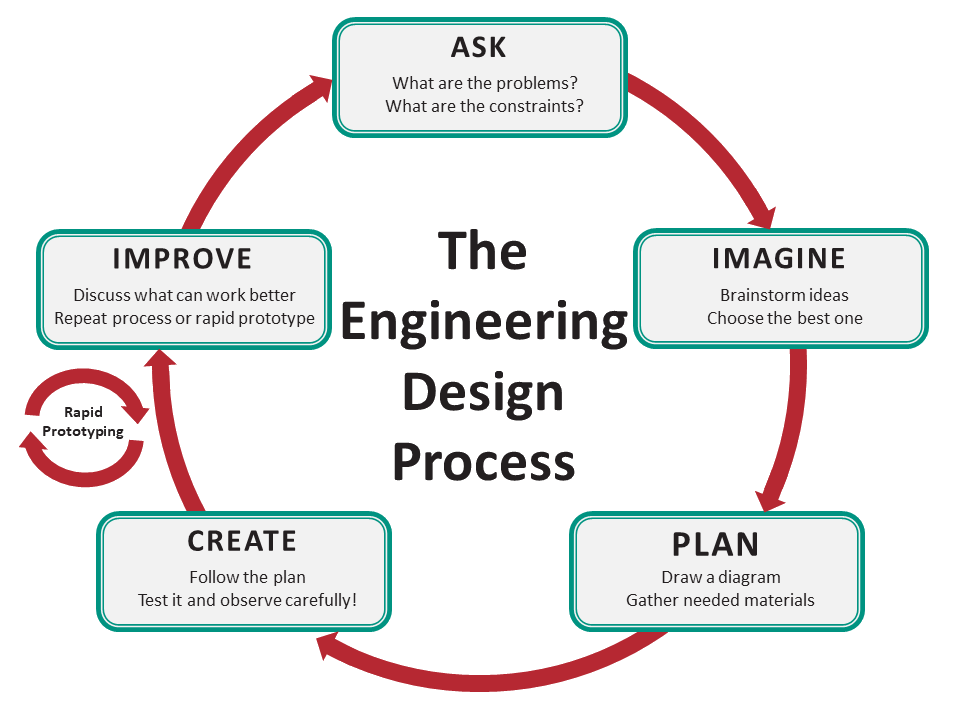
| Ask | What is the shortest route for the mailman to deliver all his mail? Can you increase the delivery driver’s rate of pay by increasing his route efficiency? |
| Imagine | You are to deliver mail to locations throughout your map. You have to make at least 4 deliveries to the various buildings on your map. Visualize the shortest route starting and ending at the post office. Think about how you can calculate the rate of pay per hour, using the total time it takes to deliver the packages and receiving $100 after the completion of the route.*Restrictions: The town should be planned using blocks/grid pattern for efficiency The Post Office and homes must be located on different sides of different blocksNo two buildings can be on the same block or on the same side of two adjoining blocks |
| Plan | You need to create a neighborhood map that includes at least 5 buildings, one being the post office. The map needs to have roadways for the sphero to travel. 15-20 minutes: Students will outline their map on graph paper.30-45 minutes: Draw your map using 1-2 pieces of chart paper. Make sure you have at least 5 buildings represented on your map, including the post office. Draw a scale/key and neatly color your map. **Or use the previous map from “Area of Triangles and Special Quadrilaterals” lesson. Each group member will create a different route, drive that route, and record the total time it takes to travel the route. Using this method you will determine the quickest route from the post office to each of the remaining 4 buildings. |
| Create | 30 minutes: Using your tablets and spheros, each group member needs to calculate a different route for the mailman to deliver mail to all four buildings (starting and ending at the post office). If he makes $100 to complete his route, how much does he get paid per hour? Afterwards, the group will find the pay rate per hour for the routes created, if $100 was received after completion of the route.All work must be shown on paper. Your map needs to include a key and be neatly colored and thoughtfully designed. |
| Improve | After reviewing the activity, students are asked how they could improve the efficiency of the layout in the town; ie roads that allow travel along the hypotenuse |
| Closure / Student Reflections | Students will fill out a reflection form with questions about their learning experience. |
| Possible Modifications / Extensions | Ideas for extensionsExtensions: Students will find the longest and shortest route the mailman could take and calculate his pay per hour. Students will then compare the rate of pay for the longest route to the shortest route. Students may want to program the Sphero to reduce variables associated with driving and giving truer comparisons between routes. |
