This website explains aquaculture, provides examples, and explains NOAA's role in regulation.
- Subject:
- Earth Science
- Science
- Material Type:
- Lesson
- Provider:
- National Oceanic and Atmospheric Administration
- Author:
- NOAA
- Date Added:
- 02/26/2019

This website explains aquaculture, provides examples, and explains NOAA's role in regulation.
This video discusses the causes and effects of ocean acidification.
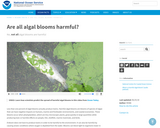
This article and video highlights the facts about algal blooms, which can destroy biodiversity and affect coastlines.
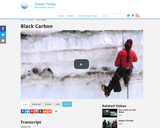
Black carbon, another name for soot, is shown in this video, and contributes to the melting of sea ice.

Students will describe at least three chemotrophic symbioses known from deep-sea habitats and identify and explain at least three indicators of chemotropic nutrition.

This toolkit was designed to support educators in teaching the fundamental scientific concepts of climate change.

This video animates the rise of Carbon Dioxide over the decades.

This activity will allow students to use several web tools to analyze CO2 concentrations from sites around the globe.
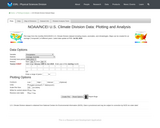
Through static map interface, the Climate Diagnostic Center provides access to plots of current and historical United States temperature, precipitation and PDSI drought maps. The interface allows users to plot the raw data and view map visualizations of data.

In this activity, students analyze maps of shipping lanes and whale sightings to propose a new shipping lane through the Stellwagon Bank National Marine Sanctuary to minimize ship strikes on whales. Students will read background information and conduct additional internet research to gather information. Then students will take on roles of the key stakeholders in this issue and work collaboratively to develop new a new plan, discussing problems and possible solutions. One representative from each group will share the plan with the rest of the class.

This series of lessons focuses on two biological ocean communities - hydrothermal vents and seamounts. Students will learn about the organisms within these communities, the ecological relationships among them, and the impact of physical factors on distribution and abundance. In Lesson Plan 22, "Who Promised You a Rose Garden," students will conduct research to discover what types of organisms live near hydrothermal vents. In Lesson Plan 23, "Biological Communities of Alaska Seamounts," students will infer why biological communities on seamounts are likely to contain unique or endemic species and will use species occurrence data to calculate and index of similarity between two biological seamount communities. In Lesson Plan 24, "Would You Like a Sample?" students will test the advantages and limitations of several sampling techniques to study biological communities.

Students manipulate virtual variables such as wind strength and direction, latitudinal location, atmospheric moisture, and sea temperature to create ideal conditions for hurricane formation in this interactive activity.
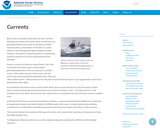
This tutorial gives a comprehensive overview of currents.

Students will examine and discuss how speed affects the ability of a current to transport sediment or sand, and then apply information from the demonstrations to the problem of working in underwater submersibles around undersea landforms. This curriculum guide provides background information and a lesson outline related to the effects topography of the ocean floor has on ocean current speed.

This website demonstrates how seasons work at the North Pole.

This activity has students investigate solar wind and the results it has on the Earth's geomagnetic field

This activity helps students understand how energy (photon) is transferred from the sun.
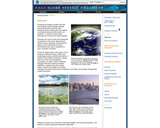
This NOAA resource summarizes facts about estuaries.

This series of lessons focuses on the impacts - both positive and negative - that humans have on the oceans. In Lesson Plan 25, "Seals, Corals and Dollars...," students will study the Northwestern Hawaiian Islands ecosystem and research the environmental issues surrounding monk seals and precious corals of the region and the management of these species. In Lesson Plan 26, "Polar Bear Panic!" students will graphically analyze data on sea ice cover in the Arctic Ocean and discuss possible causes and effects of the trends in the data.

Students will describe at least two ways in which current flow may affect food capture by particle-feeding organisms.