In this lesson, students will use the first quadrant of the coordinate plane to graph points.
- Subject:
- Mathematics
- Material Type:
- Lesson Plan
- Provider:
- Shodor Education Foundation
- Author:
- The Shodor Education Foundation, Inc
- Date Added:
- 02/26/2019

In this lesson, students will use the first quadrant of the coordinate plane to graph points.
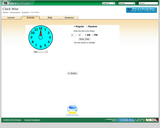
For this interactive, students practice reading a clock, input times for the clock to display, or let the clock generate random times for them to read. Students choose from three difficulty levels.
In this lesson, students learn how to compare fractions. Students begin by drawing a picture to compare fractions then interact with a computer program.
This lesson utilizes the concepts of cross-sections of three-dimensional models to demonstrate the derivation of two-dimensional shapes.
In this lesson, students will learn about elapsed time and how to find the elapsed time given the starting and ending time.
In this lesson, students explore elapsed time given a starting time and the number of hours that passed.

In this lesson, students will generate and analyze an algebraic pattern. Students will describe two different patterns. The first pattern taken from Koch's Snowflakes and the second pattern taken from a population of wolves and rabbits.
In this lesson, students will understand the concept of a factor. Students will determine the factors that belong to a whole number.
In this lesson, students explore factors of whole numbers. Students work with a computer program in order to practice factorization.
In this lesson, students explore remainders using Pascal's triangle.
In this lesson, students explore using decimals to represent fractional amounts. Students compare fractions to decimal amounts.
In this lesson, student explore fractions using themselves as manipulatives. Teacher reads the students a story about a King that divides his "subjects" into different groups creating fractions. Students discuss the fractional parts that are created and work in pairs to place small squares into equal groups.
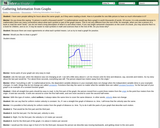
On this webpage, a simulated discussion about motion graphs between students and a mentor takes place with sample graphs illustrated. The discussion explains how to read motion graphs and what information we can gather from them.
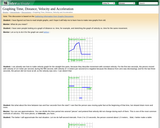
On this webpage, a discussion takes place between students and a mentor about making different types of motion graphs. Illustrations of the graphs discussed are included. This is the second in a series of discussions.
The activity and two discussions that make up this lesson introduce ideas that are the basis of probability theory. By using everyday experiences and intuitive understanding, this lesson gives students a gradual introduction to probability.
This lesson allows students to learn what bar graphs are used for, how to interpret the data presented, and how to organize their own data using bar graphs.
In this lesson, students are introduced to different quadrilaterals. Students will discuss and compare rectangles, parallelograms and trapezoids.
In this lesson, students explore how length, perimeter and area are related.
In this lesson, students will explore the effect of multiplying a whole number by a fraction or a mixed number.
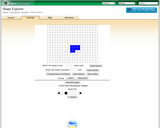
This online interactive allows students to demonstrate their abiltiy to calculate area and perimeter of a given figure. The interactive informs students if their answers are correct or not, as well as provides scores.