In this lesson, students use data from a random sample to estimate …
In this lesson, students use data from a random sample to estimate a population mean. Students understand the term "sampling variability" in the context of estimating a population mean.
In this lesson, students use data from a random sample to estimate …
In this lesson, students use data from a random sample to estimate a population mean. Students know that increasing the sample size decreases the sampling variability of the sample mean.
In this lesson, students make inferences from sample data to develop understanding …
In this lesson, students make inferences from sample data to develop understanding of proportional relationships, including percentages. Students examine samples for bias by categorizing scenarios in the warm-up, and then use random samples to predict outcomes in larger populations.
For this task, Minitab software was used to generate 100 random samples …
For this task, Minitab software was used to generate 100 random samples of size 16 from a population where the probability of obtaining a success in one draw is 33.6% (Bernoulli). Given that multiple samples of the same size have been generated, students should note that there can be quite a bit of variability among the estimates from random samples and that on average, the center of the distribution of such estimates is at the actual population value and most of the estimates themselves tend to cluster around the actual population value.
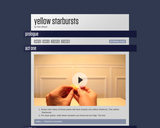
In this activity, students are trying to guess how many miniature Starburst …
In this activity, students are trying to guess how many miniature Starburst packs will have exactly one yellow Starburst, two yellow Starbursts. This activity is one of many provided by Dan Meyer from his series The Three Acts Of A Mathematical Story. These activities address the question "How do we turn the world outside the math classroom into a math problem that's both fun and challenging, not boring and easy?"
No restrictions on your remixing, redistributing, or making derivative works. Give credit to the author, as required.
Your remixing, redistributing, or making derivatives works comes with some restrictions, including how it is shared.
Your redistributing comes with some restrictions. Do not remix or make derivative works.
Most restrictive license type. Prohibits most uses, sharing, and any changes.
Copyrighted materials, available under Fair Use and the TEACH Act for US-based educators, or other custom arrangements. Go to the resource provider to see their individual restrictions.