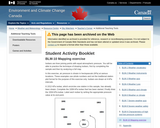
Students use a UV meter to monitor UV over a period of …
Students use a UV meter to monitor UV over a period of several hours and correlate it to atmospheric conditions. After collecting data, students will create a graph and also compare their data to the day's UV index forecast.
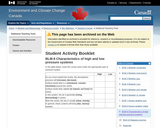
This handout is to be used with the activity "What a Wacky …
This handout is to be used with the activity "What a Wacky Winter!" In this activity students design an experiment to determine how the energy from the sun heats water and land differently.
These are the student instructions for the activity "What a Wacky Winter!" …
These are the student instructions for the activity "What a Wacky Winter!" In this activity students design an experiment to determine how the energy from the sun heats water and land differently.
No restrictions on your remixing, redistributing, or making derivative works. Give credit to the author, as required.
Your remixing, redistributing, or making derivatives works comes with some restrictions, including how it is shared.
Your redistributing comes with some restrictions. Do not remix or make derivative works.
Most restrictive license type. Prohibits most uses, sharing, and any changes.
Copyrighted materials, available under Fair Use and the TEACH Act for US-based educators, or other custom arrangements. Go to the resource provider to see their individual restrictions.