- Author:
- Carrie Robledo
- Subject:
- English Language Arts
- Material Type:
- Activity/Lab
- Level:
- High School
- Tags:
- License:
- Creative Commons Attribution Non-Commercial
- Language:
- English
Education Standards
Post test Career Research Infographic
Pretest_ Career Research Infographic
ELA - Career Research Product
Overview
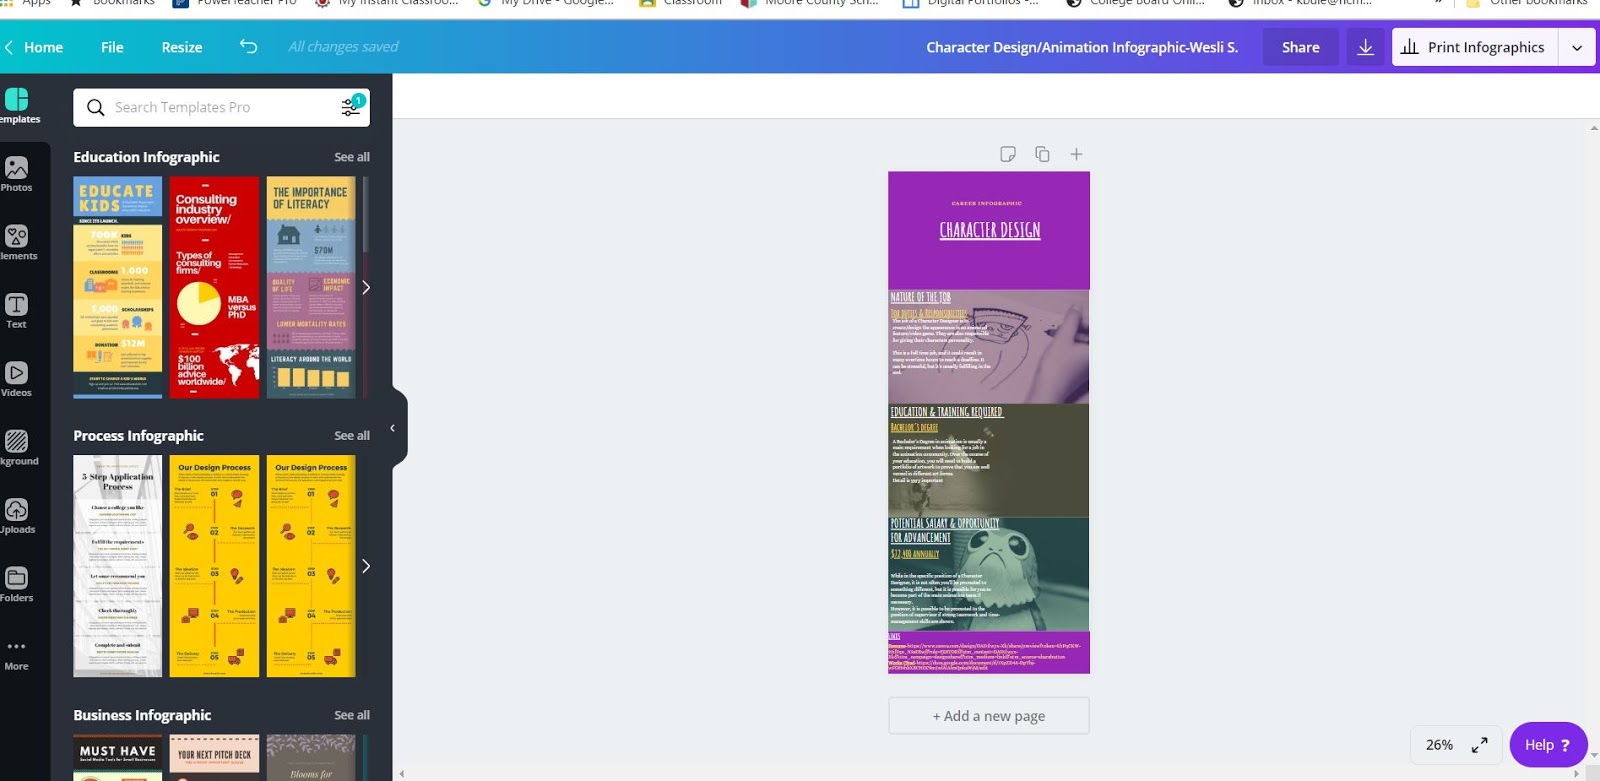
Students will use digital tools to produce and publish individual infographics. Each student will insert their Infographic into a digital book which will showcase all student career investigations and serve as a future guide for career path questions.
Instructor Directions
| Name of Project: Career Research Product |
Project Description | |
| Name of Project | Career Research Product |
| Subject Area | English |
| Targeted Standards | SL.11-12.5 |
| Driving Question / Problem / Activator | What are the benefits of using an infographic to display my career research? |
| Project Summary | Students will use digital tools to produce and publish individual infographics. Each student will insert their Infographic into a digital book which will showcase all student career investigations and serve as a future guide for career path questions. |
| Estimated Time | 180 minutes |
| Materials / Resources (including link to slideshow if available) | Students have been researching their chosen career path. They have already evaluated sources for credibility and created at least three research fact sheets using Cornell notes and their citation information.Students will need access to:
|
| Tags | #Infographic #Careerresearch |
Project Outline | |
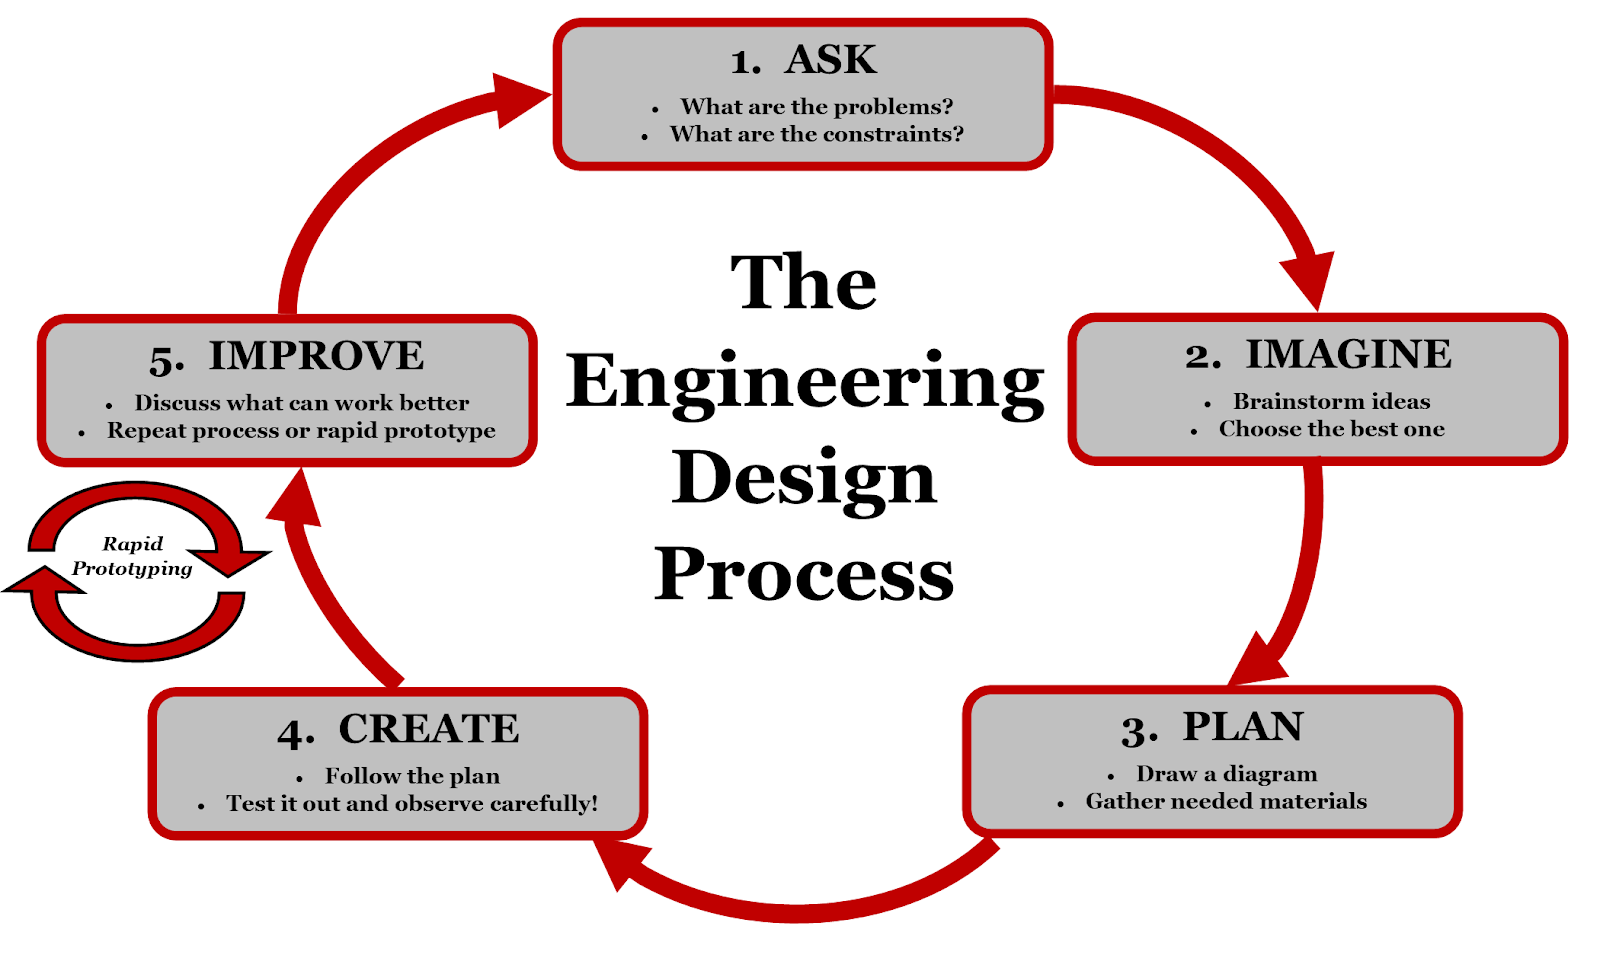
| Ask | You will create an infographic to showcase a career path of your choosing. |
| Imagine | Imagine that you will represent your company at a career fair. You will use an eye-catching infographic to recruit new people to your chosen field of work. |
| Plan | Students will create a sketch on paper to create a layout to organize research that will be embedded in their digital design. Elements should include educational requirement, salary, etc..based on the research conducted. |
| Create | Students will create their digital Career Research Infographic using the infographic tool |
| Improve | Students will work with a partner ( think- pair-share) and provide feedback regarding design and layout of the Infographic. Students will also receive feedback from their community professional. |
| Closure / Student Reflections | Each student will insert their Infographic into a digital book (we will use www.bookcreator.com) which will showcase all student career investigations and serve as a future guide for career path questions. |
| Possible Modifications / Extensions | Using their research information, students can create a predicted future resume for their chosen career path. There are many resume builders on canva.com. |
Evaluation (Pre/Post)
https://docs.google.com/document/d/1F6iiI7l4sHVc_SOcwiCCm1zHkX8YCF9gC6IuV-EG1xU/edit?usp=sharing
https://docs.google.com/document/d/1hzyrbZkQy0cXt5Gsko_IegnDRKHiO9vuMPRwFIlKOpw/edit?usp=sharing
Credits or Modified From
Analyzing Infographics: https://creativeeducator.tech4learning.com/2013/lessons/Infographics
Additional Resources / Help for teaching this lesson
Sample Pictures / Video
 | |