In this lesson, students practice their fluency skills by performing their freaky frog poem aloud to a peer.
- Subject:
- English Language Arts
- Material Type:
- Lesson Plan
- Provider:
- EngageNY
- Date Added:
- 04/26/2017

In this lesson, students practice their fluency skills by performing their freaky frog poem aloud to a peer.
In this lesson, students edit their work from the previous lessons.
In this lesson, students learn the elimination method for solving a system of linear equations. Students use properties of rational numbers to find a solution to a system, if it exists, through computation using substitution and elimination methods.
In this lesson, students solve word problems with subtraction of 9 from 10.
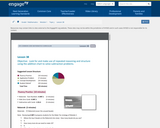
In this lesson, students look for and make use of repeated reasoning and structure using the addition chart to solve subtraction problems.
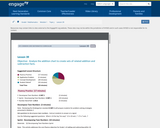
In this lesson, students analyze the addition chart to create sets of related addition and subtraction facts.
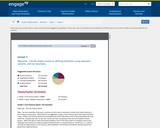
In this lesson, students classify shapes based on defining attributes using examples, variants, and non-examples.
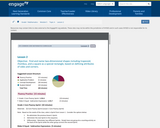
In this lesson, students find and name two-dimensional shapes including trapezoid, rhombus, and a square as special rectangle, based on defining attributes of sides and corners.
In this lesosn, students find and name three-dimensional shapes including cone and rectangular prism, based on defining attributes of faces and points.
In this lesson, students show that the slope of a line joining any two distinct points of the graph of y = mx + b has slope, m. Students transform the standard form of an equation into y = -(a/b)x + (c/b).
In this lesson, students understand the value of a ratio A:B is A/B. They understand that if two ratios are equivalent, the ratios have the same value. Students use the value of a ratio to solve ratio problems in a real-world context. Students use the value of a ratio in determining whether two ratios are equivalent.
In this lesson, students compare estimated probabilities to those predicted by a probability model.

Students estimate the mean and median of a distribution represented by a dot plot or a histogram. Students indicate that the mean is a reasonable description of a typical value for a distribution that is symmetrical, but the median is a better description of a typical value for a distribution that is skewed. Students interpret the mean as a balance point of a distribution. Students indicate that for a distribution in which neither the mean nor the median is a good description of a typical value, the mean still provides a description of the center of a distribution in terms of the balance point.
In this lesson, students estimate probabilities by collecting data on an outcome of a chance experiment. Students use given data to estimate probabilities.
In this lesson, student will know that when the square of a side of a right triangle represented as a2, b2, c2 or is not a perfect square, they can estimate the side length as between two integers and identify the integer to which the length is closest.
In this lesson, students use data from a random sample to estimate a population proportion.
Students read and comment on examples from the media (newspaper and Internet) that involve estimating a population proportion or a population mean. Students calculate the margin of error and compare their calculations with the published results. In addition, students interpret the margin of error in the context of the article and comment on how the survey was conducted.
Students read and comment on examples from the media that involve statistical experiments that compare two treatments.
This lesson introduces Venn diagrams to represent the sample space and various events and sets the stage for the two lessons that follow, which introduce students to probability formulas. The purpose is to provide a bridge between using the two-way table approach and using formulas to calculate probabilities. Venn diagrams also provide an opportunity to visually represent the population needed to understand what is requested in the exercises.
Given a description of a statistical experiment, students identify the response variable and the treatments. Students recognize the different purposes of random selection and of random assignment.cStudents recognize the importance of random assignment in statistical experiments.