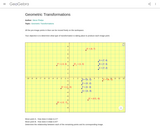
Read the Fine Print
Interactive tool that allows user to transform functions and see effects on domain and range.
- Subject:
- Mathematics
- Material Type:
- Interactive
- Provider:
- GeoGebra
- Date Added:
- 05/31/2018
Interactive tool that allows user to transform functions and see effects on domain and range.
Ana Donevska Todorova Humboldt Universitハt zu Berlin Mathematisch-Naturwissenschaftliche Fakultハt II Institut f゚r Mathematik, Didaktik der Mathematik
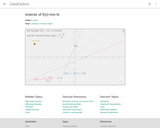
Interactive tool that allows one to see how the inverse of y=mx+b changes when the slope changes.
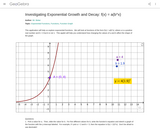
Interactive geogebra activity all about geometric growth and decay.
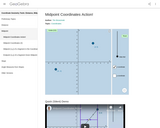
Geogebra activity that allows students to physically see the midpoint and endpoints of a segment.
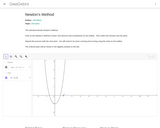
This models Newton's Method using a custom tool.
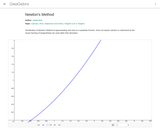
A visual demo of Newton's Method for pre-calculus students.
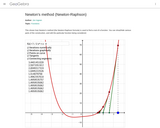
This shows how Newton's method (also known as Newton-Raphson) is used to find a root of a function. You can show/hide various parts of the construction, and edit the particular function being considered.
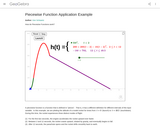
Interactive application of a piecewise function.
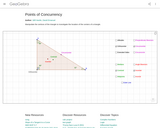
This interactive resource allows a teacher or student to manipulate the vertices of the triangle to investigate the location of the centers of a triangle.
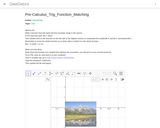
Students will create their own sine function to match a picture of mountains. This will teach them what the coefficents of trig functions do.
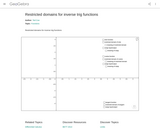
Interactive tool to see how the domains of trig functions need to be restricted for an inverse to exist.
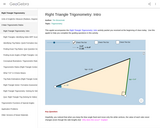
Geogebra interactive resource using trig properties.
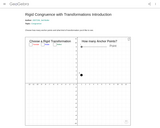
Goegebra activity demonstrating rigid transformations.
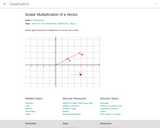
Simply shows multiplication of a vector by a scalar. Adjust he slider to adjust the multiple. Drag the point at the end of vector v to change the original vector.
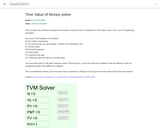
This is a solver for problems involving the time value of money (TVM). It emulates the TVM solver on the TI-83+ and TI-84 graphing calculators. Updated 6 November 2011 to work correctly when I% = 0.
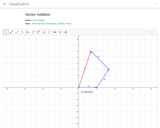
Addition of three Vectors, and displays resultant Vectors. Can drag the endPoints of the three different Vectors, but the resultant always starts at the origin.
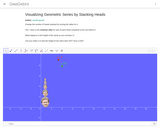
My pre-Calculus students were having trouble visualizing what it meant for a geometric series to converge. They understood the formula aspect and how to calculate the value of a convergent sum, and saw what it meant for numbers adding successively, but I