
Unit that compares the growth rates of linear, exponential and quadratic functions.
- Subject:
- Mathematics
- Material Type:
- Activity/Lab
- Provider:
- Weebly
- Date Added:
- 02/12/2018

Unit that compares the growth rates of linear, exponential and quadratic functions.

In this Khan Academy activity, students will compare features of linear functions in word problems.

In this video, the user is given the formula and a table of values that represent two people climbing a wall, and is asked to determine which one started out higher.

In this video, the user is given a table of values that represents four people walking to school, and is asked to determine which one started out farther from the school.

Students create models and understand the differences between linear and exponential models that are represented in different way.
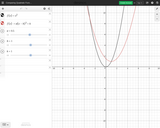
Desmos activity which shows the differences between quadratic equations.

In this Khan Academy activity, students will construct exponential expressions from word problems.

The purpose of the task is to help students think about how two quantities vary together in a context where the rate of change is not given explicitly but is derived from the context.

Lesson and practice problems using midpoint, slope and distance formula to prove that figures are certain types of quadrilaterals.

In this Khan Academy activity, students will solve word problems on a coordinate plane using the formulas for distance, area, and perimeter.
Website with everything about correlations and associations.

Khan video explaining the correlation coefficient and what it means in terms of the data set.

Practice worksheet on association, correlation and causation.

Students will be able to interpret word problems to create equations in one variable and solve them (i.e., determine the solution set) using factoring and the zero product property

Task that has students create two functions relating the number of gallons of gasoline produced by crude oil.

This resource is a unit on choosing correct graphical representation based on type of data.
The primary purpose of this task is to assess students' knowledge of certain aspects of the mathematics described in the A.SSE.1. The task has students look for structure in algebraic expressions related to a context, and asks them to relate that structure to the context.

The goal of this task is to look at the impact of outliers on two important statistical measures of center: the mean and the median.

Students will use data on the organization, spending, and populations of governments at different levels (city or town, county, and state) to compare and contrast the distributions of these variables in graphs, analyzing the shape, center, and spread of each.

Students construct a dot plot from a data set; Students calculate the mean of a data set and the median of a data set; Students observe and describe that measures of center (mean and median) are nearly the same for distributions that are nearly symmetrical; Students observe and explain why the mean and median are different for distributions that are skewed; Students select the mean as an appropriate description of center for a symmetrical distribution and the median as a better description of center for a distribution that is skewed.