This set of three videos illustrates how math is used in satellite …
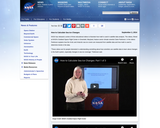
This set of three videos illustrates how math is used in satellite data analysis. The videos feature NASA senior climate scientist Claire Parkinson. Parkinson explains how the Arctic and Antarctic sea ice covers are measured from satellite data and how math is used to determine trends in the data. In the first video, she leads viewers from satellite data collection through obtaining a time series of monthly average sea ice extents for November 1978 – December 2012, for the Arctic and Antarctic. In the second video, she begins with the time series from the first video, removes the seasonal cycle by calculating yearly averages, and proceeds to calculate the slopes of the lines to get trends in the data, revealing decreasing sea ice coverage in the Arctic and increasing sea ice coverage in the Antarctic. In the third video, she uses a more advanced technique to remove the seasonal cycle and shows that the trends are close to the same, whichever method is used. She emphasizes the power of math and that the techniques shown for satellite sea ice data can also be applied to a wide range of data sets.
Putting Math to Work Type of Unit: Problem Solving Prior Knowledge Students …
Putting Math to Work
Type of Unit: Problem Solving
Prior Knowledge
Students should be able to:
Solve problems involving all four operations with rational numbers. Write ratios and rates. Write and solve proportions. Solve problems involving scale. Write and solve equations to represent problem situations. Create and interpret maps, graphs, and diagrams. Use multiple representations (i.e., tables, graphs, and equations) to represent problem situations. Calculate area and volume. Solve problems involving linear measurement.
Lesson Flow
Students apply and integrate math concepts they have previously learned to solve mathematical and real-world problems using a variety of strategies. Students have opportunities to explore four real-world situations involving problem solving in a variety of contexts, complete a project of their choice, and work through a series of Gallery problems.
First, students utilize their spatial reasoning and visualization skills to find the least number of cubes needed to construct a structure when given the front and side views. Then, students select a project to complete as they work through this unit to refine their problem-solving skills. Students explore the relationship between flapping frequency, amplitude, and cruising speed to calculate the Strouhal number of a variety of flying and swimming animals. After that, students explore the volume of the Great Lakes, applying strategies for solving volume problems and analyzing diagrams. Next, students graphically represent a virtual journey through the locks of the Welland Canal, estimating the amount of drop through each lock and the distance traveled. Students have a day in class to work on their projects with their group.
Then, students have two days to explore Gallery problems of their choosing. Finally, students present their projects to the class.
I turned each 5-part episode (each segment last about 14 mintues) in …
I turned each 5-part episode (each segment last about 14 mintues) in an end-of-class activity for students. For days 1-4, students would review the first 4 parts and make notes in their individual investigation ntoebooks (a.k.a. compoisiton books). They would record math concepts, questions they had about the investigation, and any people of interest. On day 5, usually Friday, students would watch the last segment, and then complete their weekly investigation form, focusing on using their notebooks for math concepts, persons of itnerest, questions from the investigation, etc.,Two results of this activity are:Students are more engaged in learning about the day's content and less inclined to be passive learners.Students are seeing concepts covered in both my and previous math classes and how they can be utilized in everyday life.I believe this is asissting students in become not only more active learniers, but also in becoming practical learners where the can utilize content to assist in solving problems.I've attached two of the investigation forms. One is a completed verison of "The Case of the Missing Baseball" and the other is a ready for completion verison of "The Case of the Dirty Money" The videos themselves are available on various Youtube channels, and I have heard that the program is available on DVD.
No restrictions on your remixing, redistributing, or making derivative works. Give credit to the author, as required.
Your remixing, redistributing, or making derivatives works comes with some restrictions, including how it is shared.
Your redistributing comes with some restrictions. Do not remix or make derivative works.
Most restrictive license type. Prohibits most uses, sharing, and any changes.
Copyrighted materials, available under Fair Use and the TEACH Act for US-based educators, or other custom arrangements. Go to the resource provider to see their individual restrictions.