A 2-D map is a great guide here on Earth—and virtually worthless …
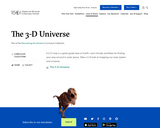
A 2-D map is a great guide here on Earth—and virtually worthless for finding your way around in outer space. Take a 3-D look at mapping our solar system and universe. This Moveable Museum article, available as a printable PDF file, looks at how astronomers use data to create 3-D models of the universe. Explore these concepts further using the recommended resources mentioned in this reading selection.
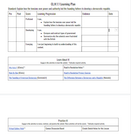
This is a document to obtain data. List the antecedent to the …
This is a document to obtain data. List the antecedent to the behavior that is presented. Then the behavior that occurred. Lastly, write the consequence that was given for the behavior. Outline the time and setting that the behavior took place. Then document a hypothesized explanation of why the behavior was displayed.
The AirData website provides access to air pollution data for the entire …
The AirData website provides access to air pollution data for the entire United States. Users have the ability to produce reports and maps of air pollution data based on criteria that they specify.
The purpose of this resource is to quantitatively evaluate the accuracy of …
The purpose of this resource is to quantitatively evaluate the accuracy of a classification system. Students sort birds into three possible classes based on each bird's beak: carnivores, herbivores, and omnivores. Students compare their answers with a given set of validation data.
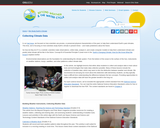
This is an activity about the moon. Learners will create their own …
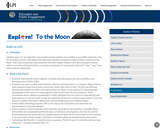
This is an activity about the moon. Learners will create their own models of lunar orbiters out of edible or non-edible materials. They determine what tools would be necessary to help us better understand the Moon and plan for a future lunar outpost. Then they incorporate these elements into their models. NASA's Lunar Reconnaissance Orbiter is used as an example of a spacecraft armed with "eyes," "ears," and other tools for exploration. This activity is part of Explore! To the Moon and Beyond! - a resource developed specifically for use in libraries.
The resource is an advanced learning plan that was created using the …
The resource is an advanced learning plan that was created using the Modern Teacher method. It follows the new Civic Literacy standards, specifically CL.H.1.1. This will provide students a pathway through the standard and breaks it into "Learn About It", "Practice It", and "Evidence of Learning" sections. It also provides assessments at a developing and proficient level.This resource was developed as part of a professional learning opportunity funded by the NCDPI Digital Learning Initiative Planning Grant.
In this scenario-based, problem-based learning (PBL) activity, students investigate cloud formation, cloud …
In this scenario-based, problem-based learning (PBL) activity, students investigate cloud formation, cloud classification, and the role of clouds in heating and cooling the Earth; how to interpret TRMM (Tropical Rainfall Measuring Mission) images and data; and the role clouds play in the Earth’s radiant budget and climate. Students assume the role of weather interns in a state climatology office and assist a frustrated student in a homework assignment. Learning is supported by a cloud in a bottle and an ice-albedo demonstration, a three-day cloud monitoring outdoor activity, and student journal assignments. The hands-on activities require two 2-liter soda bottles, an infrared heat lamp, and two thermometers. The resource includes a teacher's guide, questions and answer key, assessment rubric, glossary, and an appendix with information supporting PBL in the classroom.
This professional development article identifies resources that show young learners (K-grade 5) …
This professional development article identifies resources that show young learners (K-grade 5) how scientists study Earth's climate and make predictions. The online lessons either allow students to collect and analyze data or learn about tools and technologies that make data collection possible. The lessons are aligned with national content standards for science education. The article appears in the free, online magazine Beyond Weather and the Water Cycle, which examines the recognized essential principles of climate literacy and the climate sciences for elementary teachers and their students.
This online article is from the Museum's Science Explorations, a collaboration between …
This online article is from the Museum's Science Explorations, a collaboration between AMNH and Scholastic designed to promote science literacy. Written for students in grades 6-10, this article from Science World magazine has an interview with AMNH astrophysicist Mike Shara, in which he explains what space objects are and what happens when they collide. There are Web links that offer further opportunities for learning about space objects and their collisions.
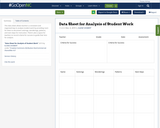
This data sheet allows teachers a consistent and organized way to analyze …
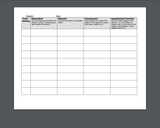
This data sheet allows teachers a consistent and organized way to analyze student work by providing room for them to document noticings, wonderings, patterns, and next steps for instruction. There's also a space for teachers to record criteria for success to guide their lens for analysis.
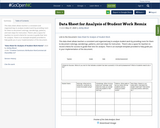
This data sheet allows teachers a consistent and organized way to analyze …
This data sheet allows teachers a consistent and organized way to analyze student work by providing room for them to document noticings, wonderings, patterns, and next steps for instruction. There's also a space for teachers to record criteria for success to guide their lens for analysis. There is an example template provided to help guide you in your implementation of the document.
This lesson incorporates sea surface data collected by NASA satellites. Data for …
This lesson incorporates sea surface data collected by NASA satellites. Data for three surface characteristics- height, temperature and speed- are used for several activities. Students examine the differences in speed of currents relative to distance from the Equator. Sea surface data anomalies are charted and further analyzed. In addition, surface current data is presented to examine patterns related to El Niño. Note that this is lesson three of five on the Ocean Motion website. Each lesson investigates ocean surface circulation using satellite and model data and can be done independently. See Related URL's for links to the Ocean Motion Website that provide science background information, data resources, teacher material, student guides and a lesson matrix.
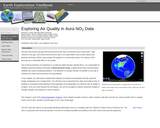
In this chapter, students will explore relationships between air quality and population …
In this chapter, students will explore relationships between air quality and population density using the image visualization tool, Google Earth. You will learn how to download NO2 data and analyze them to develop a conceptual understanding of how population and topography can influence the air quality of a region. Once you have learned the techniques, you are encouraged to explore seasonal changes in nitrogen dioxide concentrations at other locations. This chapter is part of the Earth Exploration Toolbook (EET). Each EET chapter provides teachers and/or students with direct practice for using scientific tools to analyze Earth science data. Students should begin on the Case Study page.
In this activity, students examine the first line of evidence, galactic motion, …
In this activity, students examine the first line of evidence, galactic motion, for the notion of an expanding universe. By examining the spectrum of light from a galaxy, students can determine whether a galaxy is moving toward or away from us, and how fast. Students will look at optical images of four galaxies, compare the emission spectra from these same four galaxies, and measure the wavelength of the red hydrogen line for each galaxy. This activity is part of the "Cosmic Questions" educator's guide developed to support the Cosmic Questions exhibit. This activity can be used in conjunction with, or independently of, the exhibit.
Student teams explore atmospheric aerosols, dust, and fires and their impact on …
Student teams explore atmospheric aerosols, dust, and fires and their impact on the Earth's albedo using NASA Earth Observations (NEO) website. This is an extension activity in the student learning activity guide accompanying the GLOBE Earth System Poster, Exploring Connections in Year 2007. A series of six learning activities and associated assessment activities are included.
In this activity, student teams explore connections between parts of the Earth …
In this activity, student teams explore connections between parts of the Earth system, by examining a time series of environmental data maps. By examining scientific visualizations of a data pair in two time slices, they will see that the environment is the result of the interplay among many processes that take place on varying time and spatial scales. This is one of six interrelated learning activities associated with the GLOBE Earth System Poster, Exploring Connections in Year 2007, which also includes a series of assessment and extension activities. GLOBE (Global Learning and Observation to Benefit the Environment) is a worldwide, hands-on, K-12 school-based science education program.
In this activity, student teams explore the connections between parts of the …
In this activity, student teams explore the connections between parts of the Earth system by examining a time series of environmental data maps. Each student teams examines images for two variables and determines if there is a direct or inversely proportional relationship exhibited between them throughout the year. The variable pairs that student groups are observing include: insolation and surface temperature; cloud fraction and precipitation; aerosols and biosphere. This is one of six interrelated learning activities associated with the GLOBE Earth System Poster, "Exploring Connections in Year 2007," and includes a series of assessment and extension activities. GLOBE (Global Learning and Observation to Benefit the Environment) is a worldwide, hands-on, K-12 school-based science education program.
In this activity, student teams explore connections between parts of the Earth …
In this activity, student teams explore connections between parts of the Earth system, by examining a time series of environmental data maps. Each team examines a single variable displayed on a global data map, and identify the unit of measure, the range of values, and patterns they observe in the data. Variables include: insolation, surface temperature, precipitation, cloud fraction, aerosols, biopshere. This is one of six interrelated learning activities associated with the GLOBE Earth System Poster, "Exploring Connections in Year 2007," and includes a series of assessment and extension activities. GLOBE (Global Learning and Observation to Benefit the Environment) is a worldwide, hands-on, K-12 school-based science education program.
Students will explore time series plots and raw data to understand the …
Students will explore time series plots and raw data to understand the role of sea surface temperature increases on arctic ice melt. This is part three of a four-part activity on polar science. The activity builds on the knowledge gained in Using Data and Images to Understand Albedo (part 2). Extension activities examining air and sea surface temperature in relation to changing Earth albedo are included. Information is provided on data access using the NOAA Earth System Research Laboratory Web site. This activity is one of several learning activities connected with the 2007 GLOBE Earth system poster.
No restrictions on your remixing, redistributing, or making derivative works. Give credit to the author, as required.
Your remixing, redistributing, or making derivatives works comes with some restrictions, including how it is shared.
Your redistributing comes with some restrictions. Do not remix or make derivative works.
Most restrictive license type. Prohibits most uses, sharing, and any changes.
Copyrighted materials, available under Fair Use and the TEACH Act for US-based educators, or other custom arrangements. Go to the resource provider to see their individual restrictions.