In this lesson, students compare experimental results with mathematical expectations of probabilities …
In this lesson, students compare experimental results with mathematical expectations of probabilities and determine odds for and odds against a given situation.
This is a task from the Illustrative Mathematics website that is one …
This is a task from the Illustrative Mathematics website that is one part of a complete illustration of the standard to which it is aligned. Each task has at least one solution and some commentary that addresses important aspects of the task and its potential use.
In this lesson, students are given a box plot to summarize the …
In this lesson, students are given a box plot to summarize the data by the 5-number summary (Min, Q1, Median, Q3, Max.) and describe a set of data using the 5-number summary and the interquartile range. Students also construct a box plot from a 5-number summary.
This task was developed by high school and postsecondary mathematics and design/pre-construction …
This task was developed by high school and postsecondary mathematics and design/pre-construction educators, and validated by content experts in the Common Core State Standards in mathematics and the National Career Clusters Knowledge & Skills Statements. It was developed with the purpose of demonstrating how the Common Core and CTE Knowledge & Skills Statements can be integrated into classroom learning - and to provide classroom teachers with a truly authentic task for either mathematics or CTE courses.
This task was developed by high school and postsecondary mathematics and health …
This task was developed by high school and postsecondary mathematics and health sciences educators, and validated by content experts in the Common Core State Standards in mathematics and the National Career Clusters Knowledge & Skills Statements. It was developed with the purpose of demonstrating how the Common Core and CTE Knowledge & Skills Statements can be integrated into classroom learning - and to provide classroom teachers with a truly authentic task for either mathematics or CTE courses.
In this lesson, students understand that a meaningful difference between two sample …
In this lesson, students understand that a meaningful difference between two sample means is one that is greater than would have been expected due to just sampling variability.
Students will build and launch Magnus Effect gliders and measure the distance …
Students will build and launch Magnus Effect gliders and measure the distance they fly. They will analyze the data to judge which material gives the glider the most distance. Then they may do the same process for other variables.
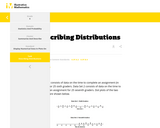
In this lesson, students are given a data set to describe the …
In this lesson, students are given a data set to describe the data collected, including the number of responses, mean or median, and the MAD or the interquartile range (IQR).
This is a task from the Illustrative Mathematics website that is one …
This is a task from the Illustrative Mathematics website that is one part of a complete illustration of the standard to which it is aligned. Each task has at least one solution and some commentary that addresses important aspects of the task and its potential use.
No restrictions on your remixing, redistributing, or making derivative works. Give credit to the author, as required.
Your remixing, redistributing, or making derivatives works comes with some restrictions, including how it is shared.
Your redistributing comes with some restrictions. Do not remix or make derivative works.
Most restrictive license type. Prohibits most uses, sharing, and any changes.
Copyrighted materials, available under Fair Use and the TEACH Act for US-based educators, or other custom arrangements. Go to the resource provider to see their individual restrictions.