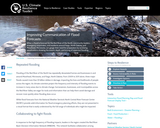
When a flood is forecast for the Red River of the North, …
When a flood is forecast for the Red River of the North, community leaders, emergency responders, and residents around Fargo, North Dakota, and Moorhead, Minnesota, can gauge their need for preparation by accessing visualizations showing the extent, depth, and timing of expected flooding.
Students can learn to visualize the effects of multiplying a fixed positive …
Students can learn to visualize the effects of multiplying a fixed positive number by positive numbers greater than 1 and less than 1 with this tool. Using interactive figures, students can investigate how changing the height of a rectangle with a fixed width changes its area. e-Math Investigations are selected e-examples from the electronic version of the Principles and Standards of School Mathematics (PSSM). The e-examples are part of the electronic version of the PSSM document. Given their interactive nature and focused discussion tied to the PSSM document, the e-examples are natural companions to the i-Math investigations.
Putting Math to Work Type of Unit: Problem Solving Prior Knowledge Students …
Putting Math to Work
Type of Unit: Problem Solving
Prior Knowledge
Students should be able to:
Solve problems involving all four operations with rational numbers. Write ratios and rates. Write and solve proportions. Solve problems involving scale. Write and solve equations to represent problem situations. Create and interpret maps, graphs, and diagrams. Use multiple representations (i.e., tables, graphs, and equations) to represent problem situations. Calculate area and volume. Solve problems involving linear measurement.
Lesson Flow
Students apply and integrate math concepts they have previously learned to solve mathematical and real-world problems using a variety of strategies. Students have opportunities to explore four real-world situations involving problem solving in a variety of contexts, complete a project of their choice, and work through a series of Gallery problems.
First, students utilize their spatial reasoning and visualization skills to find the least number of cubes needed to construct a structure when given the front and side views. Then, students select a project to complete as they work through this unit to refine their problem-solving skills. Students explore the relationship between flapping frequency, amplitude, and cruising speed to calculate the Strouhal number of a variety of flying and swimming animals. After that, students explore the volume of the Great Lakes, applying strategies for solving volume problems and analyzing diagrams. Next, students graphically represent a virtual journey through the locks of the Welland Canal, estimating the amount of drop through each lock and the distance traveled. Students have a day in class to work on their projects with their group.
Then, students have two days to explore Gallery problems of their choosing. Finally, students present their projects to the class.
Students will practice visualizing and understanding that visualization is an important comprehension …
Students will practice visualizing and understanding that visualization is an important comprehension strategy. Students will share their visualization of the story through original artwork.
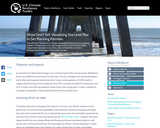
City officials in Tybee Island, Georgia, recognized sea level rise as a …
City officials in Tybee Island, Georgia, recognized sea level rise as a growing problem for their community. Visualizations from a sea level rise viewer helped them raise awareness of the city's vulnerabilities and led to development of Georgias first sea level rise plan.
This article discusses the reading comprehension strategy of visualization and how it …
This article discusses the reading comprehension strategy of visualization and how it can be used to enhance students' understanding of content-area text. Templates and links are provided.
No restrictions on your remixing, redistributing, or making derivative works. Give credit to the author, as required.
Your remixing, redistributing, or making derivatives works comes with some restrictions, including how it is shared.
Your redistributing comes with some restrictions. Do not remix or make derivative works.
Most restrictive license type. Prohibits most uses, sharing, and any changes.
Copyrighted materials, available under Fair Use and the TEACH Act for US-based educators, or other custom arrangements. Go to the resource provider to see their individual restrictions.