This lesson addresses what measure of variability is appropriate for a skewed …
This lesson addresses what measure of variability is appropriate for a skewed data distribution. Students construct a box plot of the data using the 5-number summary and describe variability using the interquartile range.
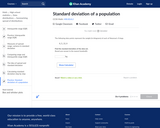
Students calculate standard deviation for the first time and examine the process …
Students calculate standard deviation for the first time and examine the process for its calculation more closely. Through questioning and discussion, students link each step in the process to its meaning in the context of the problem and explore the many questions about the rationale behind the development of the formula.
In four linked activities, students will apply their knowledge of ratios, proportions, …
In four linked activities, students will apply their knowledge of ratios, proportions, fractions, decimals, percents, scientific notation, mean, median, mode, range, and pie graphs to interpret data and statistics regarding the U.S. government’s budget for prisons and correctional services. Then students will synthesize what they have learned and communicate it using diagrams and mathematical evidence.
This lesson unit is intended to help teachers assess how well students …
This lesson unit is intended to help teachers assess how well students are able to interpret data using frequency graphs and box plots. In particular this unit aims to identify and help students who have difficulty figuring out the data points and spread of data from frequency graphs and box plots. It is advisable to use the lesson: Representing Data 1: Frequency Graphs, before this one.
The lesson prepares students for a future understanding of the standard deviation …
The lesson prepares students for a future understanding of the standard deviation of a data set, focusing on the role of the deviations from the mean. Students practice calculating deviations from the mean and generalize their calculations by relating them to the expression ?? - ??¯. Students reflect on the relationship between the sizes of the deviations from the mean and the spread (variability) of the distribution.
No restrictions on your remixing, redistributing, or making derivative works. Give credit to the author, as required.
Your remixing, redistributing, or making derivatives works comes with some restrictions, including how it is shared.
Your redistributing comes with some restrictions. Do not remix or make derivative works.
Most restrictive license type. Prohibits most uses, sharing, and any changes.
Copyrighted materials, available under Fair Use and the TEACH Act for US-based educators, or other custom arrangements. Go to the resource provider to see their individual restrictions.