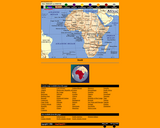
This interactive map of Africa contains links to country maps which provide …
This interactive map of Africa contains links to country maps which provide information such as, population, flag, language, capital, industry, and agriculture.
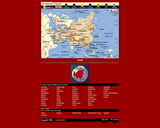
This interactive map of Asia contains links to country maps which provide …
This interactive map of Asia contains links to country maps which provide information such as, population, flag, language, capital, industry, and agriculture.
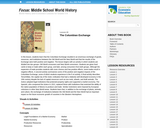
Students learn that the Columbian Exchange resulted in an enormous exchange of …
Students learn that the Columbian Exchange resulted in an enormous exchange of goods, resources, and institutions between the Old World and the New World and that the results of the Exchange were both positive and negative. Slides for the lesson are included.
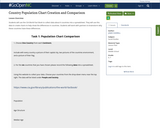
Students will use the CIA World Fact Book to collect data about …
Students will use the CIA World Fact Book to collect data about 6 countries into a spreadsheet. They will use this data to create charts to help show the differences in countries. Students will work with partners to brainstorm why these countries have these differences.
The Japanese Weather Patterns unit provides students opportunities to interpret and analyze …
The Japanese Weather Patterns unit provides students opportunities to interpret and analyze trends in weather patterns over many years in both Japan and the United States. Students will compare the annual rainfall and average temperatures at different times of the year in both places. Students will also identify ways the Japanese culture and weather patterns are reflected in the artwork of Mount Fuji and will construct haikus reflective of Japanese culture and weather patterns as depicted in art.
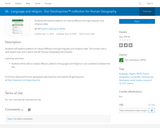
Students will explore patterns of cultural diffusion through linguistic and religious data. …
Students will explore patterns of cultural diffusion through linguistic and religious data.
GeoInquiries are designed to be fast and easy-to-use instructional resources that incorporate advanced web mapping technology. Each 15-minute activity in a collection is intended to be presented by the instructor from a single computer/projector classroom arrangement. No installation, fees, or logins are necessary to use these materials and software.
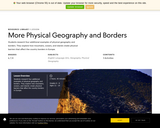
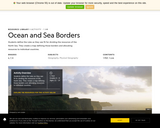
Students research four additional examples of physical geography and borders. They explore …
Students research four additional examples of physical geography and borders. They explore how mountains, oceans, and islands create physical barriers that affect the country borders in Europe.
This interactive map of North America contains links to country maps which …
This interactive map of North America contains links to country maps which provide information such as, population, flag, language, capital, industry, and agriculture.
This interactive map of the North Pole contains links to country maps …
This interactive map of the North Pole contains links to country maps which provide information such as, population, flag, language, capital, industry, and agriculture.
Students define the rules as they see fit for dividing the resources …
Students define the rules as they see fit for dividing the resources of the North Sea and create a map defining those borders and allocating resources to individual countries.
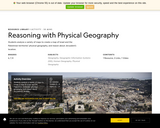
Students analyze a variety of maps to create a map of Israel …
Students analyze a variety of maps to create a map of Israel and the Palestinian territories' physical geography, and reason about Jerusalem's location.
This interactive map of South America contains links to country maps which …
This interactive map of South America contains links to country maps which provide information such as, population, flag, language, capital, industry, and agriculture.
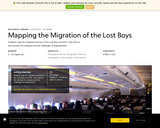
In this activity, students will learn about population movement, migration trends, and …
In this activity, students will learn about population movement, migration trends, and thewestward expansion of the early 1800s. First, students will create a line graph that depicts changes in aggregated population data from 1800 to 1850 for Illinois, Indiana, Missouri, and Ohio. Using this graph, students will make data comparisons and draw conclusions. Next, students will compare the populations of several states between 1790 and 1850 and make conclusions that demonstrate their understanding of population trends in northern and southern states. This activity can spark discussion of sectionalism, slavery, and the different economic climate that took shape in the northern and southern states in the early 1800s.
This inquiry leads students through an investigation of water access in the …
This inquiry leads students through an investigation of water access in the Middle East using various sources that consider geographical, political and economic issues. By investigating the compelling question, students examine the geography of the region, including environmental and demographic relationships, the ecological impact of accessing water, and the subsequent political conflicts over control of natural resources.
This resource provides global demographic data which includes indicators on the status …
This resource provides global demographic data which includes indicators on the status of women in key areas such as education, employment, and government.
No restrictions on your remixing, redistributing, or making derivative works. Give credit to the author, as required.
Your remixing, redistributing, or making derivatives works comes with some restrictions, including how it is shared.
Your redistributing comes with some restrictions. Do not remix or make derivative works.
Most restrictive license type. Prohibits most uses, sharing, and any changes.
Copyrighted materials, available under Fair Use and the TEACH Act for US-based educators, or other custom arrangements. Go to the resource provider to see their individual restrictions.