- Author:
- Pearson
- Subject:
- Statistics and Probability
- Material Type:
- Lesson Plan
- Level:
- Middle School
- Grade:
- 7
- Provider:
- Pearson
- Tags:
- License:
- Creative Commons Attribution Non-Commercial
- Language:
- English
- Media Formats:
- Interactive, Text/HTML
Using Measures of Center & Spread To Analyze Data

Overview
Students estimate the length of 50 seconds by starting an unseen timer and stopping it when they think 50 seconds has elapsed. The third attempt is recorded and compiled into a data set, which students then compare to the third attempt from the previous lesson when they estimated the length of 20 seconds. Students analyze the data to make conclusions about how well seventh grade students can estimate lengths of time.
Students repeat the timing activity for 50 seconds, but only the third trial is recorded. The task today is to compare this set of data with the third trial for 20 seconds. Students will need to deal with the difference in the spread of data, as well as how to compare the data sets. Students will be reminded of Mean Absolute Deviation (MAD), which will be a useful tool in this situation.
Key Concepts
Students apply the tools learned in Unit 6.8:
- Measures of center and spread
- Mean absolute deviation (MAD)
Goals and Learning Objectives
- Apply knowledge of statistics to compare different sets of data.
- Use measures of center and spread to analyze data.
Math Mission
Lesson Guide
Discuss the Math Mission. Students will compare data sets from different experiments using a variety of tools.
SWD: Students with disabilities may require review and reinforcement of mathematical tools and means of representing data. Reinforce how to interpret and utilize tools for comparing data.
Opening
Compare data sets from different experiments using a variety of tools.
How Long Is 50 Seconds?
Lesson Guide
Students will repeat the process from the previous lesson, except this time they'll estimate a 50 second interval. Conduct a class poll for the class's third attempt at estimating 50 seconds, so students only have the one data set for estimating 50 seconds.
SWD: Students with disabilities may need review and reinforcement of the major skills and concepts covered in this lesson. Have students use this time to summarize lesson as an opportunity to review and reinforce.
Work Time
How Long Is 50 Seconds?
How does your ability to estimate time vary with different time intervals? Once again, you will first need to collect some data.
- Using the 50 Seconds Timer interactive, utilize the Start and Stop buttons to estimate when you think 50 seconds have passed.
- The interactive will record and display your time estimate.
- Repeat the process two more times.
How can you compare the measures of center and spread for the two sets of data?
INTERACTIVE: 50 Seconds Timer
Compare Data Sets
Lesson Guide
Students will also have access to their third attempt at estimating 20 seconds as well as their third attempt at estimating 50 seconds.
Mathematics
The task is again left open for students to decide what to do. As they work, it will become apparent that the extreme values for each set of data do not even overlap.
How does a typical time of 18 seconds for the 20 second time compare to a typical time of 48 seconds for the 50 second time? Percentages can be used to compare the measures to see how close the times were, relative to the time being estimated (e.g., 18 is 90% of 20, while 48 is 96% of 50). Look for or encourage capable students to use this method.
Encourage other students to calculate the MAD for each set of data. This will give an idea of how close each set of data is to the mean and if the data is spread or not. Students should describe the two MADs in relative terms (e.g., the MADs for the 50 second estimates were twice the MADs for the 20 second estimates).
ELL: Developing and deepening student understanding of terms is essential. Building vocabulary and/or concepts in the context of real-life word problems and experiences ensures that students will “own” the new words and concepts they encounter.
Interventions
Student has trouble getting started.
- What are some of the tools you can use to analyze data?
- Did you check the Hints?
- Have you looked at the range?
- How can you compare the measures of center and spread for both sets of data?
Student has a solution.
- Why did you approach the problem the way you did?
- Explain your strategy for solving the problem.
- How do you know that this is the typical score?
- How did you compare the typical scores?
Answers
- Answers will vary, and are dependent on the actual data sets.
Work Time
Compare Data Sets
Compare your estimates for 50-second intervals to your estimates for 20-second intervals. Use your data set from the third trial for the 50-second intervals and your data set from the third trial for the 20-second intervals. Do not use graphs to make your comparison. Think about the following questions:
- What tools can you use to analyze the data?
- What evidence can you use to justify your conclusion?
- What is the range for each data set?
- How can you compare the data sets?
- How can you compare the measures of center and spread for the two sets of data?
- How can you compare two data sets when the numbers in each data set are based on different times—that is, 20 seconds versus 50 seconds?
Prepare a Presentation
Lesson Guide
Presentations will vary.
Preparing for Ways of Thinking
Look for examples of the different ways that students compared the data to share during Ways of Thinking (e.g., students that found measures of center and/or spread but did not compare them by percentages, students that used percentages for comparisons, and students that calculated the MAD).
Challenge Problem
Answers
- Answers will vary, and are dependent on the actual data sets.
Work Time
Prepare a Presentation
- Prepare a presentation about what how you analyzed your data sets and their results and conclusions.
Challenge Problem
- Find the mean absolute deviation for the combined data. What does this value tell you about the data sets?
Make Connections
Mathematics
Have students share their conclusions and evidence to justify their conclusions. Remind students that everyone used the same sets of data. Emphasize that percentages need to be used to compare the measures.
- Did you round the numbers to whole numbers? Why or why not?
- What was the range of data for 50 seconds?
- What was the typical time for estimating 50 seconds?
- How did you compare this to the typical 20 second time?
- How can you/did you compare the middle 50% for each data set?
- Why did you use the measures you did?
- What does the MAD tell you about the data sets?
- How do the MADs compare?
- Do seventh grade students estimate longer or shorter intervals of time better?
- Can we generalize this conclusion to all seventh grade students? Why or why not?
- Even though everyone used the same data sets, why didn't we arrive at the same conclusions?
At this point, it might be worthwhile to discuss how the data could be compared on a graph. If both sets of data were graphed, we would need to alter the scale to show percentages to give a relative comparison. The same scale needs to be used for both graphs, and would show how close each estimate is by percent. The data may or may not be clustered around 100%.
For example, since 20 × 5 = 100, we would multiply each data point by 5 for the 20 second results. We would find that 14 seconds would become 70%, and 25 seconds would become 125%. Since 50 × 2 = 100, we would multiply each data point by 2 for the 50 second results. We would find that 40 seconds would become 80% and 55 seconds would become 110%. This means that a time of 18 seconds would show directly above (or below) a time of 45 seconds because both are 90% of the actual time. Students are probably not ready for this comparison, but it is worth discussing.
ELL: Provide adequate pace, and present the questions and instructions in writing. Provide sentence frames as appropriate, but ELLs might not need them, especially if the questions are shown in writing, since students can ‘borrow’ some of the words from the questions themselves to construct their answers.
SWD: Some students may struggle to determine the salient information from the presentations. Provide students with summaries to reinforce the key ideas from the presentations. It will also model for students how to create strong summaries of mathematical information.
Performance Task
Ways of Thinking: Make Connections
- Take notes about the tools your classmates used to analyze the data sets and their results and conclusions.
As your classmates present, ask questions such as:
- Did you round the numbers to whole numbers? Why or why not?
- How does the range of your 50 second data set compare with the range of your 20 second data set?
- What was your typical time for estimating 50 seconds?
- How did you compare this time to your typical time for estimating 20 seconds?
- How can you compare the middle 50% of the values for each data set?
- Why did you use those measures of center to analyze the data?
- Based on your results, what conclusion can you make about your estimation skills for longer versus shorter intervals of time?
- Can you generalize your conclusion to all seventh grade students? Why or why not?
Comparing Different Data Sets
A Possible Summary
Many factors need to be considered in comparing data. Measures of center and spread can be used as well as different types of graphs. There are a range of tools to use for different situations. To compare data sets of different size or different scale, using percentages and calculating the MAD are important.
ELL: Provide ELLs and other students a sample or model for the concepts, strategies, and applications that will be addressed in the Assessment, as well as the format you want them to follow. Be prepared to address and explicitly re-teach or review vocabulary, concepts, strategies, and applications.
Formative Assessment
Summary of the Math: Comparing Different Data Sets
- Write a summary about comparing different data sets.
Check your summary:
- Do you explain how to compare data sets?
- Do you describe the tools you can use to analyze data and make comparisons?
- Do you explain how to deal with data sets of different sizes or scales?
Estimate the Weight of Water
Lesson Guide
This task allows you to assess students’ work and determine what difficulties they are having. The results of the Self Check will help you determine which students should work on the Gallery problems and which students would benefit from review before the assessment. Have students work on the Self Check individually.
Assessment
Have students submit their work to you. Make notes on what their work reveals about their current levels of understanding and their different problem-solving approaches.
Do not score students’ work. Share with each student the most appropriate Interventions to guide their thought process. Also note students with a particular issue so that you can work with them in the Putting It Together lesson that follows.
Interventions
Student does not understand the idea of a random, representative sample.
- How many seventh grade students are in the school?
- How many students should be in the sample?
- How should the sample be chosen?
- How should each class be represented?
Student does not understand how to analyze the data.
- What measures can you use to decide what is typical for the data?
- What graph could you draw to represent the data visually?
Student does not understand how to use ratios to generalize for the population.
- How many students are in the sample? How many students are in the population?
- How many students in the sample think the water weighs between 7 and 9 lbs?
- Using your knowledge about the sample, how can you estimate the number of students in the entire seventh grade think a gallon of water weighs between 7 and 9 lbs?
Student provides a poor explanation. For example, the student explains calculations rather than gives mathematical reasons.
- How can you convince a student in another class that your answer is correct?
Student provides adequate solutions to all questions.
- Can you find a different way to solve the problem?
Answers
Answers will vary. Possible answers:
- Lucy needs to select a random sample for her data collections. One way to do this would be to write the numbers 1 to 300 on slips of paper, attaching each number to a student, then drawing a few randomly to generate a sample. Each student should be surveyed separately so their answers don't influence other students' answers.
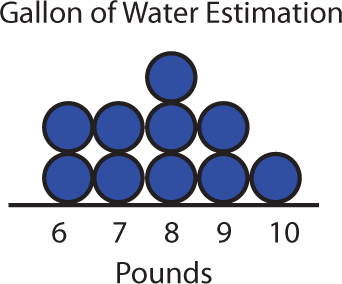
- Based on the sample, a typical seventh grade student thinks that a gallon of water weighs 8 lbs.
- The median and mode are 8 lbs, and the mean (7.8) rounds to 8 lbs. The range is 4, from 6 to 10, with the data clustered around 8 lbs.
- 210 students, or 70% or of students in the sample, think a gallon of water weighs between 7 and 9 lbs. The whole population is 300 (10 classes of 30 students each).
Formative Assessment
Self Check: Estimate the Weight of Water
Complete this Self Check by yourself.
A school has 10 seventh grade classes, each with 30 students. Lucy wants to find out how well the students can estimate the weight of a gallon of water. She realizes that she cannot survey everyone, but she isn’t sure how to proceed.
- How could Lucy go about collecting her data? Lucy decides to start with a random sample of 10 seventh grade students. The students made the following estimates for the weight of a gallon of water (in pounds): 6, 7, 9, 8, 7, 10, 8, 6, 9, 8
- Based on this sample, what does a typical seventh grade student at the school think a gallon of water weighs?
- How did you reach your conclusion?
- Based on the sample, how many seventh grade students at the school think that a gallon of water weighs between 7 and 9 lbs?
Reflect on Your Work
Lesson Guide
Have students write a brief reflection before the end of the class. Review the reflections to find out what students still find confusing about sampling and comparing data sets.
Work Time
Reflection
Write a reflection about the ideas discussed in class today. Use the sentence starter below if you find it to be helpful.
Something that still confuses me about sampling and comparing data sets is…