This lesson teaches students about direct variation by allowing them to explore …
This lesson teaches students about direct variation by allowing them to explore a simulated oil spill using toilet paper tissues (to represent land) and drops of vegetable oil (to simulate a volume of oil).
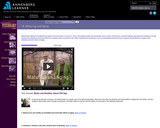
Students explore quadratic functions by using a motion detector known as a …
Students explore quadratic functions by using a motion detector known as a Calculator Based Ranger (CBR) to examine the heights of the different bounces of a ball. Students will represent each bounce with a quadratic function of the form y = a (x - h)^2 + k. This lesson plan is based on the activity Tremain Nelson uses in the video for Part II of this workshop.
Students classify the different types of numbers we use, and learn how …
Students classify the different types of numbers we use, and learn how numbers and operations relate to one another. They start with counting numbers and then add integers, rationals, algebraic, and, finally, real numbers to the line.
Students build staircases out of square blocks. They look for patterns and …
Students build staircases out of square blocks. They look for patterns and come up with a rule or formula to predict the number of blocks in any staircase.
Students collect data on the number of raisins in 17 boxes of …
Students collect data on the number of raisins in 17 boxes of raisins. They will use the data to analyze data and interprete results, answer a series of questions about variation, and construct data in plots.
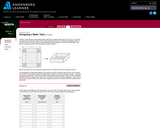
Students Imagine constructing an open-topped water tank from a square metal sheet. …
Students Imagine constructing an open-topped water tank from a square metal sheet. They investigate the relationship between the maximum volume of the tank and the size of the squares cut from the corners, build models and collect data.
This video demonstrates the difference between heat and temperature and examines how …
This video demonstrates the difference between heat and temperature and examines how both are defined in terms of particles. It illustrates the transfer of heat energy and uses a particle model to explain a number of everyday phenomena, including why things expand when they are heated to the role that temperature plays in changes of states of matter.
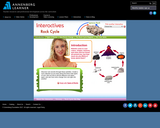
Students can read short articles about rock types, the rock cycle, and …
Students can read short articles about rock types, the rock cycle, and identifying rocks. Students can collect rocks in a virtual rock collection and learn about each one. A short quiz is provided at the end for students to test their own knowledge.
Students explore the dependence of one variable on another and develop a …
Students explore the dependence of one variable on another and develop a formula describing the number of toothpicks as a function of the number of squares.
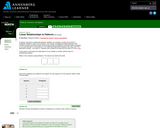
Students will learn to use mathematical models to represent real life situations. …
Students will learn to use mathematical models to represent real life situations. In particular, they will use tables and equations to represent the relationship between the number of revolutions made by a "driver" and a "follower" (two connected gears in a system), and they will explain the significance of the radii of the gears in regard to this relationship.
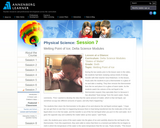
Students will look at the human life cycle in spans of 20-25 …
Students will look at the human life cycle in spans of 20-25 years, and what happens physically and mentally as we age. Popular misconceptions about the eldery are examined, often in contrast to the reality of growing old.
This lesson provides students with an introduction to exponential functions. The class …
This lesson provides students with an introduction to exponential functions. The class first explores the world population since 1650. Students then conduct a simulation in which a population grows at a random yet predictable rate. Both situations are examples of exponential growth.
Students will learn how to write an equation of a linear function …
Students will learn how to write an equation of a linear function when given a set of data. They will interpret the meaning of the slope and y-intercept and then use the equation to find other values of x and y.
This lesson requires students to explore quadratic functions by examining the family …
This lesson requires students to explore quadratic functions by examining the family of functions described by y = a (x - h)^2 + k. This lesson plan is based on the activity Tremain Nelson used in the video for Part I of this workshop.
No restrictions on your remixing, redistributing, or making derivative works. Give credit to the author, as required.
Your remixing, redistributing, or making derivatives works comes with some restrictions, including how it is shared.
Your redistributing comes with some restrictions. Do not remix or make derivative works.
Most restrictive license type. Prohibits most uses, sharing, and any changes.
Copyrighted materials, available under Fair Use and the TEACH Act for US-based educators, or other custom arrangements. Go to the resource provider to see their individual restrictions.