This resource accompanies our Rethink 1st Grade Science Earth Systems, Structures & Processes unit. It includes ideas for use, ways to support exceptional children, ways to extend learning, digital resources and tools, tips for supporting English Language Learners and students with visual and hearing impairments. There are also ideas for offline learning.
Students will use a model of the solar system to demonstrate rotation, …
Students will use a model of the solar system to demonstrate rotation, revolution, kepler’s laws, Newton's laws, precession, nutation, seasons or tides.
This lesson will help students visualize barycenter and the relationship between the …
This lesson will help students visualize barycenter and the relationship between the sun and the earth. Students will use a solar system model to demonstrate barycenter and see the effects of adding other planets into the mix.
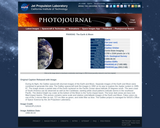
Students use NASA photographs and hands-on activities to compare the amounts of …
Students use NASA photographs and hands-on activities to compare the amounts of land and water on our planet. They discover that the world has five oceans, and that they cover 70% of Earth's surface. Students learn how this affects the entire Earth system.
Students analyze international oil consumption and production data. They make several graphs …
Students analyze international oil consumption and production data. They make several graphs to organize the data and draw conclusions about the overall use of oil in the world.
This activity is a teacher-led demonstration of continental drift and includes a …
This activity is a teacher-led demonstration of continental drift and includes a math worksheet for students involving the calculation of continental drift over time. Students will understand what continental drift is, why it occurs, and how earthquakes occur because of it.
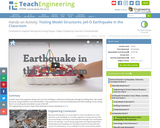
Students learn how engineers construct buildings to withstand damage from earthquakes by …
Students learn how engineers construct buildings to withstand damage from earthquakes by building their own structures with toothpicks and marshmallows. Students test how earthquake-proof their buildings are by testing them on an earthquake simulated in a pan of Jell-O(TM).
Students use a variety of fruits to construct a scale model of …
Students use a variety of fruits to construct a scale model of the Moon, Earth, and Sun. After determining the correct sizes and distances for their models, they remove the Moon and consider what it would be like if the Moon was not part of our solar system.
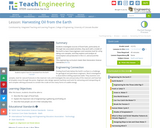
In this lesson, students investigate sources of fossil fuels, particularly oil. Students …
In this lesson, students investigate sources of fossil fuels, particularly oil. Students will learn how engineers and scientists look for oil by taking core samples from a model of the Earth. Also, students will explore and analyze oil consumption and production in the United States and around the world.
Students investigate how mountains are formed. Concepts include the composition and structure …
Students investigate how mountains are formed. Concepts include the composition and structure of the Earth's tectonic plates and tectonic plate boundaries, with an emphasis on plate convergence as it relates to mountain formation. Students learn that geotechnical engineers design technologies to measure movement of tectonic plates and mountain formation, as well as design to alter the mountain environment to create safe and dependable roadways and tunnels.
This nonfiction article, written for students in grades 4-5, explores the ways …
This nonfiction article, written for students in grades 4-5, explores the ways in which glaciers shape the Earth's land. Modified versions are available for students in younger grades.
Students use scaling from real-world data to obtain an idea of the …
Students use scaling from real-world data to obtain an idea of the immense size of Mars in relation to the Earth and the Moon, as well as the distances between them. Students calculate dimensions of the scaled versions of the planets, and then use balloons to represent their relative sizes and locations.
In this activity, students will go outside and collect nonliving earth materials, …
In this activity, students will go outside and collect nonliving earth materials, and then work in collaborative groups to sort the materials into categories of their choosing. They will describe the materials in their journal using drawings and words.
In this interactive resource, students will click and drag pictures of different …
In this interactive resource, students will click and drag pictures of different phases of the moon to complete a calendar of lunar cycles. Narration in the interactive provides ongoing feedback and guidance to the students as they work to complete the patterns. There is also a printable version of this activity, allowing for a hands-on activity where students can physically manipulate illustrations of the phases of the moon, placing them in the correct sequence in lunar cycles.
This simulation explores the sun/Earth connection. It allows variables to be manipulated …
This simulation explores the sun/Earth connection. It allows variables to be manipulated such as time of year, latitude, angle, annalema, and declination, in teaching seasons.
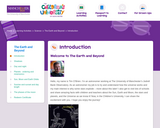
Students are introduced to our planet's structure and its dynamic system of …
Students are introduced to our planet's structure and its dynamic system of natural forces through an examination of the natural hazards of earthquakes, volcanoes, landslides, tsunamis, floods and tornados, as well as avalanches, fires, hurricanes and thunderstorms. They see how these natural events become disasters when they impact people, and how engineers help to make people safe from them. Students begin by learning about the structure of the Earth; they create clay models showing the Earth's layers, see a continental drift demo, calculate drift over time, and make fault models. They learn how earthquakes happen; they investigate the integrity of structural designs using model seismographs. Using toothpicks and mini-marshmallows, they create and test structures in a simulated earthquake on a tray of Jell-O. Students learn about the causes, composition and types of volcanoes, and watch and measure a class mock eruption demo, observing the phases that change a mountain's shape. Students learn that the different types of landslides are all are the result of gravity, friction and the materials involved. Using a small-scale model of a debris chute, they explore how landslides start in response to variables in material, slope and water content. Students learn about tsunamis, discovering what causes them and makes them so dangerous. Using a table-top-sized tsunami generator, they test how model structures of different material types fare in devastating waves. Students learn about the causes of floods, their benefits and potential for disaster. Using riverbed models made of clay in baking pans, students simulate the impact of different river volumes, floodplain terrain and levee designs in experimental trials. They learn about the basic characteristics, damage and occurrence of tornadoes, examining them closely by creating water vortices in soda bottles. They complete mock engineering analyses of tornado damage, analyze and graph US tornado damage data, and draw and present structure designs intended to withstand high winds.
No restrictions on your remixing, redistributing, or making derivative works. Give credit to the author, as required.
Your remixing, redistributing, or making derivatives works comes with some restrictions, including how it is shared.
Your redistributing comes with some restrictions. Do not remix or make derivative works.
Most restrictive license type. Prohibits most uses, sharing, and any changes.
Copyrighted materials, available under Fair Use and the TEACH Act for US-based educators, or other custom arrangements. Go to the resource provider to see their individual restrictions.