Samples and ProbabilityType of Unit: ConceptualPrior KnowledgeStudents should be able to:Understand the …
Samples and ProbabilityType of Unit: ConceptualPrior KnowledgeStudents should be able to:Understand the concept of a ratio.Write ratios as percents.Describe data using measures of center.Display and interpret data in dot plots, histograms, and box plots.Lesson FlowStudents begin to think about probability by considering the relative likelihood of familiar events on the continuum between impossible and certain. Students begin to formalize this understanding of probability. They are introduced to the concept of probability as a measure of likelihood, and how to calculate probability of equally likely events using a ratio. The terms (impossible, certain, etc.) are given numerical values. Next, students compare expected results to actual results by calculating the probability of an event and conducting an experiment. Students explore the probability of outcomes that are not equally likely. They collect data to estimate the experimental probabilities. They use ratio and proportion to predict results for a large number of trials. Students learn about compound events. They use tree diagrams, tables, and systematic lists as tools to find the sample space. They determine the theoretical probability of first independent, and then dependent events. In Lesson 10 students identify a question to investigate for a unit project and submit a proposal. They then complete a Self Check. In Lesson 11, students review the results of the Self Check, solve a related problem, and take a Quiz.Students are introduced to the concept of sampling as a method of determining characteristics of a population. They consider how a sample can be random or biased, and think about methods for randomly sampling a population to ensure that it is representative. In Lesson 13, students collect and analyze data for their unit project. Students begin to apply their knowledge of statistics learned in sixth grade. They determine the typical class score from a sample of the population, and reason about the representativeness of the sample. Then, students begin to develop intuition about appropriate sample size by conducting an experiment. They compare different sample sizes, and decide whether increasing the sample size improves the results. In Lesson 16 and Lesson 17, students compare two data sets using any tools they wish. Students will be reminded of Mean Average Deviation (MAD), which will be a useful tool in this situation. Students complete another Self Check, review the results of their Self Check, and solve additional problems. The unit ends with three days for students to work on Gallery problems, possibly using one of the days to complete their project or get help on their project if needed, two days for students to present their unit projects to the class, and one day for the End of Unit Assessment.
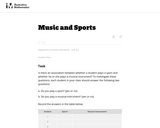
In this group task students collect data and analyze from the class …
In this group task students collect data and analyze from the class to answer the question "is there an association between whether a student plays a sport and whether he or she plays a musical instrument? "
This lesson provides students with an introduction to exponential functions. The class …
This lesson provides students with an introduction to exponential functions. The class first explores the world population since 1650. Students then conduct a simulation in which a population grows at a random yet predictable rate. Both situations are examples of exponential growth.
A work in progress, this FlexBook is an introduction to theoretical probability …
A work in progress, this FlexBook is an introduction to theoretical probability and data organization. Students learn about events, conditions, random variables, and graphs and tables that allow them to manage data.
This lesson unit is intended to help teachers assess how well students …
This lesson unit is intended to help teachers assess how well students are able to translate between graphs and algebraic representations of polynomials. In particular, this unit aims to help you identify and assist students who have difficulties in: recognizing the connection between the zeros of polynomials when suitable factorizations are available, and graphs of the functions defined by polynomials; and recognizing the connection between transformations of the graphs and transformations of the functions obtained by replacing f(x) by f(x + k), f(x) + k, -f(x), f(-x).
Place and Location are two of the five themes of geography and …
Place and Location are two of the five themes of geography and a natural starting point for a study of the Arctic and Antarctica. Location answers the question, "Where am I?" while the study of place asks, "What kind of a place is it?" and, "How does this place connect to my hometown?" This issue of Beyond Penguins and Polar Bears examines how you can introduce the Arctic and Antarctica and use science, geography, literacy, and technology to help your students compare and contrast these two dramatically different areas as well as their own home. Get ready for an adventure as you and your students develop your polar sense of place!
Beyond Penguins and Polar Bears is an online professional development magazine for elementary teachers which focuses on preparing teachers to teach polar science concepts in an already congested curriculum by integrating inquiry-based science with literacy teaching. Such an integrated approach can increase students' science knowledge, academic language, reading comprehension, and written and oral discourse abilities.
This lesson is from Tools 4 NC Teachers. This lesson involves determining …
This lesson is from Tools 4 NC Teachers. This lesson involves determining whether data is categorical, numerical, or changes over time. This is remixable.
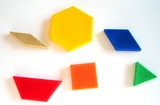
This lesson is from Tools4NCTeachers.In this lesson, students build pattern block animals …
This lesson is from Tools4NCTeachers.In this lesson, students build pattern block animals inspired by literature, describe and graph the shapes used, and interpret the data by asking and answering questions to develop the concepts of geometry and graphing. Remix this lesson to include extension ideas or samples of student work.
This article provides ideas, lessons and resources on how elementary teachers can …
This article provides ideas, lessons and resources on how elementary teachers can integrate map skills, math, and art into lessons about the geography of the Arctic and Antarctica.
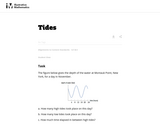
Analyze the graphs. The top graph is the buffalo population graph you …
Analyze the graphs. The top graph is the buffalo population graph you have previously examined. The bottom graph is the wildebeest population in the Serengeti during the same time period. What patterns do you notice in the table and graph?
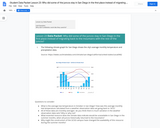
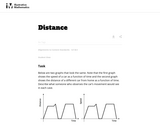
In this task students interpret two graphs that look the same but …
In this task students interpret two graphs that look the same but show very different quantities. The first graph gives information about how fast a car is moving while the second graph gives information about the position of the car. This problem works well to generate a class or small group discussion. Students learn that graphs tell stories and have to be interpreted by carefully thinking about the quantities shown.
No restrictions on your remixing, redistributing, or making derivative works. Give credit to the author, as required.
Your remixing, redistributing, or making derivatives works comes with some restrictions, including how it is shared.
Your redistributing comes with some restrictions. Do not remix or make derivative works.
Most restrictive license type. Prohibits most uses, sharing, and any changes.
Copyrighted materials, available under Fair Use and the TEACH Act for US-based educators, or other custom arrangements. Go to the resource provider to see their individual restrictions.