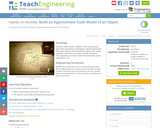
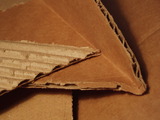
Students create models of objects of their choice, giving them skills and …
Students create models of objects of their choice, giving them skills and practice in techniques used by professionals. They make sketches as they build their objects. This activity facilitates a discussion on models and their usefulness.
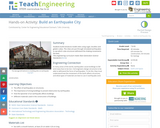
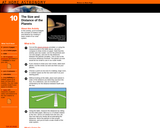
Students build miniature model cities using sugar, bouillon and gelatin cubes. The …
Students build miniature model cities using sugar, bouillon and gelatin cubes. The cities are put through simulated earthquakes to see which cube structures withstand the shaking movements the best.
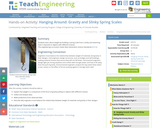
Students will use various objects in the classroom to experiment with nonstandard …
Students will use various objects in the classroom to experiment with nonstandard measurement. They will make estimates and test them out. Then, working in pairs or small groups, students will use a ruler or a measuring tape to become familiar with how to use these tools for standard linear measurement. The purpose of this activity is to practice making standard and non-standard measurement and to learn the purpose of making linear measurements and how to apply them to scientific investigations. Students will learn how to make measurements, both nonstandard and standard (with a ruler). They will test their estimates and record their results.
Four full-year digital course, built from the ground up and fully-aligned to …
Four full-year digital course, built from the ground up and fully-aligned to the Common Core State Standards, for 7th grade Mathematics. Created using research-based approaches to teaching and learning, the Open Access Common Core Course for Mathematics is designed with student-centered learning in mind, including activities for students to develop valuable 21st century skills and academic mindset.
Zooming In On Figures Unit Overview Type of Unit: Concept; Project Length …
Zooming In On Figures
Unit Overview
Type of Unit: Concept; Project
Length of Unit: 18 days and 5 days for project
Prior Knowledge
Students should be able to:
Find the area of triangles and special quadrilaterals. Use nets composed of triangles and rectangles in order to find the surface area of solids. Find the volume of right rectangular prisms. Solve proportions.
Lesson Flow
After an initial exploratory lesson that gets students thinking in general about geometry and its application in real-world contexts, the unit is divided into two concept development sections: the first focuses on two-dimensional (2-D) figures and measures, and the second looks at three-dimensional (3-D) figures and measures. The first set of conceptual lessons looks at 2-D figures and area and length calculations. Students explore finding the area of polygons by deconstructing them into known figures. This exploration will lead to looking at regular polygons and deriving a general formula. The general formula for polygons leads to the formula for the area of a circle. Students will also investigate the ratio of circumference to diameter ( pi ). All of this will be applied toward looking at scale and the way that length and area are affected. All the lessons noted above will feature examples of real-world contexts. The second set of conceptual development lessons focuses on 3-D figures and surface area and volume calculations. Students will revisit nets to arrive at a general formula for finding the surface area of any right prism. Students will extend their knowledge of area of polygons to surface area calculations as well as a general formula for the volume of any right prism. Students will explore the 3-D surface that results from a plane slicing through a rectangular prism or pyramid. Students will also explore 3-D figures composed of cubes, finding the surface area and volume by looking at 3-D views. The unit ends with a unit examination and project presentations.
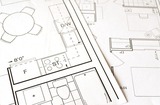
Students further explore scale, taking a scale drawing floor plan and redrawing …
Students further explore scale, taking a scale drawing floor plan and redrawing it at a different scale.Key ConceptsStudents explore change from one scale to another, focusing on the ratios. Students will draw a scale model of a house.GoalsRedraw a scale drawing at a different scale.Find measurements using a scale drawing.
Lesson OverviewStudents will work on the final portion of their project which …
Lesson OverviewStudents will work on the final portion of their project which includes creating the nets for the sides, making a slice in one of their buildings, and putting their buildings together. Once their two model buildings are complete, they will find the surface area and volume for their models and the full-size buildings their models represent.Key ConceptsThe second part of the project is essentially a review of the second half of the unit, while still using scale drawings. Students will find the surface area of a prism as well as the surface area of a truncated prism. The second prism will require estimating and problem solving to figure out the net and find the surface area. Students will also be drawing the figure using scale to find actual surface area.GoalsRedraw a scale drawing at a different scale.Find measurements using a scale drawing.Find the surface area of a prism.SWD: Students with disabilities may have a more challenging time identifying areas of improvement to target in their projects. It may be helpful to model explicitly for students (using an example project or student sample) how to review a project using the rubric to assess and plan for revisions based on that assessment.Students with fine motor difficulties may require grid paper with a larger scale. Whenever motor tasks are required, consider adaptive tools or supplementary materials that may benefit students with disabilities.Students with disabilities may struggle to recall prerequisite skills as they move through the project. It may be necessary to check in with students to review and reinforce estimation skills.
The purpose of this resource is to familiarize students with the importance …
The purpose of this resource is to familiarize students with the importance of perspective and various scales of remotely sensed data. Students create a 3-D model of an area and develop a classification system for the landforms in their model. The maps can then be used to answer certain questions about the environment.
This is a hands-on lesson that uses science and the steps of …
This is a hands-on lesson that uses science and the steps of the Engineering Design Process to determine important properties in sail design materials and learn how to harness wind power. Students will learn that a problem can be solved in different ways using different materials.
Students learn how different characteristics of shapes—side lengths, perimeter and area—change when …
Students learn how different characteristics of shapes—side lengths, perimeter and area—change when the shapes are scaled, either enlarged or reduced. Student pairs conduct a “scaling investigation” to measure and calculate shape dimensions (rectangle, quarter circle, triangle; lengths, perimeters, areas) from a bedroom floorplan provided at three scales. They analyze their data to notice the mathematical relationships that hold true during the scaling process. They see how this can be useful in real-world situations like when engineers design wearable or implantable biosensors. This prepares students for the associated activity in which they use this knowledge to help them reduce or enlarge their drawings as part of the process of designing their own wearables products. Pre/post-activity quizzes, a worksheet and wrap-up concepts handout are provided.
Learners compare a life-size drawing of a Tyrannosaurus rex head and a …
Learners compare a life-size drawing of a Tyrannosaurus rex head and a full-size Sinornithosaurus body to understand that dinosaurs varied in size. Learners trace individual pieces of a dinosaur on paper and then work together as a group to arrange the pieces of the "puzzle". This is an opportunity to understand scale drawings as well as learn how to work as a group.
This resource is from Tools4NCTeachers. In this lesson, students will create a survey …
This resource is from Tools4NCTeachers. In this lesson, students will create a survey question, collect data, create a bar graph, write and answer questions about the collected data. This lesson may take two days to complete. Printable, samples of student work, sample anchor charts, and extension ideas are included within this lesson.
This resource is from Tools4NCTeachers. This lesson will involve interviewing classmates about where …
This resource is from Tools4NCTeachers. This lesson will involve interviewing classmates about where they would like to spend their summer vacation. Their choices will be the beach, mountains, time with a relative, or camping. They will create a picture graph to represent the data collected.This lesson comes with printable materials and clipart for creating a class graph.
Students apply their knowledge of scale and geometry to design wearables that …
Students apply their knowledge of scale and geometry to design wearables that would help people in their daily lives, perhaps for medical reasons or convenience. Like engineers, student teams follow the steps of the design process, to research the wearable technology field (watching online videos and conducting online research), brainstorm a need that supports some aspect of human life, imagine their own unique designs, and then sketch prototypes (using Paint®). They compare the drawn prototype size to its intended real-life, manufactured size, determining estimated length and width dimensions, determining the scale factor, and the resulting difference in areas. After considering real-world safety concerns relevant to wearables (news article) and getting preliminary user feedback (peer critique), they adjust their drawn designs for improvement. To conclude, they recap their work in short class presentations.
The engineers at Splash Engineering (the students) have been commissioned by Thirsty …
The engineers at Splash Engineering (the students) have been commissioned by Thirsty County to conduct a study of evaporation and transpiration in their region. During one week, students observe and measure (by weight) the ongoing evaporation of water in pans set up with different variables, and then assess what factors may affect evaporation. Variables include adding to the water an amount of soil and an amount of soil with growing plants.
No restrictions on your remixing, redistributing, or making derivative works. Give credit to the author, as required.
Your remixing, redistributing, or making derivatives works comes with some restrictions, including how it is shared.
Your redistributing comes with some restrictions. Do not remix or make derivative works.
Most restrictive license type. Prohibits most uses, sharing, and any changes.
Copyrighted materials, available under Fair Use and the TEACH Act for US-based educators, or other custom arrangements. Go to the resource provider to see their individual restrictions.