This project will be focused on designing, constructing and evaluating different containers …
This project will be focused on designing, constructing and evaluating different containers to determine the optimal design for heat retention. After students have constructed their designs and collected and shared data, students will evaluate the class data to create an optimal design for our culminating event: warming ooey, gooey chocolate chip cookies to perfection! Through this activity, students will learn about energy transfer, engineering design process, data collection, graphing, rate of change, optimization, surface area and proportions. The students will test the effectiveness of their design using Vernier Probes to gather quantitative data and graphing the rate of temperature change. They will then create a poster presentation to share their data to the class. Students will use their mathematical skills to quantitatively analyze the strength and weaknesses of their designs while enjoying some delicious, toasty, warm cookies.
This is a 21 day unit on the topic of floods. Students …
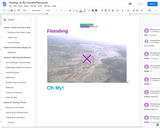
This is a 21 day unit on the topic of floods. Students will plan and prepare for what might happen in the event of a flood in our area. We have had floods in the past that have affected the Walterville School, its campus, and the surrounding areas. Using this as a springboard, students will discuss the effects of flooding, do research and interview family members who have experienced flooding, and then discuss possible ways to prevent significant damage on the buildings and surrounding areas. They will then design a barrier that could protect an area from damage for a period of time. Students will need materials to conduct experiments. We have listed these in the lesson plan. We have also included a trip to the Leaburg Dam so that students can learn about dams and their uses. We plan on teaching this unit in the fall.
About 4.6 billion years ago, a cloud of interstellar dust, ice crystals, …
About 4.6 billion years ago, a cloud of interstellar dust, ice crystals, and gas collapsed to form a rapidly rotating disk with a young sun at its center: our solar system. This comic strip, a supplement to the Hall of Meteorites Educator's Guide, explains the processes that led to the creation of the planets and the asteroid belt.
The Gamma-ray Burst Skymap website automatically updates for each gamma-ray burst as …
The Gamma-ray Burst Skymap website automatically updates for each gamma-ray burst as it occurs, whether detected by Swift or other orbiting satellites. For each burst, the location on the sky, star map, constellation and detecting mission are generated automatically. It is then quickly updated by hand to include a written description of the burst properties and scientific significance, as observations continue. Note: In order to view the content of the website, users need to download and install Silverlight on their computers.
This lesson examines the effects of surface energy transfer and storage on …
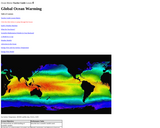
This lesson examines the effects of surface energy transfer and storage on ocean temperatures. Included are activities that introduce the use of scientific models. Students then use an energy flow computer model to track energy changes by manipulating four variables: solar energy, heat transfer, water transparency, and seasons of the year. Note that this is lesson four of five on the Ocean Motion website. Each lesson investigates ocean surface circulation using satellite and model data and can be done independently. See Related URL's for links to the Ocean Motion Website that provide science background information, data resources, teacher material, student guides and a lesson matrix.
This is a lesson about planetary atmospheres. Learners will interpret real spectral …
This is a lesson about planetary atmospheres. Learners will interpret real spectral graphs from missions to determine what some of Earth, Venus, and Mars’ atmosphere is composed of and then mathematically compare the amount of the greenhouse gas, CO2, on the planets Venus, Earth, and Mars in order to determine which has the most. Students brainstorm to figure out what things, along with greenhouse gases, can affect a planet’s temperature. The activity is part of Project Spectra, a science and engineering program for middle-high school students, focusing on how light is used to explore the Solar System.
This is an activity about the relation between day length and temperature. …
This is an activity about the relation between day length and temperature. In one team, learners will create and analyze a graph of hours of sunlight versus month of the year for a number of latitudes. In another team, learners will graph temperature versus month for the same latitudes. The teams then compare data and draw conclusions from their analyses.
We owe our lives to gravity. It holds the atmosphere to Earth …
We owe our lives to gravity. It holds the atmosphere to Earth and keeps us all from falling off into space. Not to mention that without gravity, the stars and planets—including Earth—wouldn't even exist! This Moveable Museum article, available as a nine-page printable PDF file, introduces the key concepts of gravity, orbits, weight, and weightlessness.
The museum's Milstein Family Hall of Ocean Life explores the diverse, complex …
The museum's Milstein Family Hall of Ocean Life explores the diverse, complex web of life supported by the ocean and the vital inter-relationships between human and aquatic systems. This insert to the hall guide is designed to help you maximize your trip to the museum.
This is a lesson about representative sampling. When given parts of the …
This is a lesson about representative sampling. When given parts of the Hubble Deep Field image, learners will count the number of galaxies in one sample section of the image. Then, they will calculate how many galaxies there are in each whole image and how many objects the Hubble Space Telescope could see in the entire Universe. This is Activity H-6 of Universe at Your Fingertips 2.0: A Collection of Activities and Resources for Teaching Astronomy DVD-ROM, which is available for purchase.
In this 2-part inquiry-based lesson, students conduct a literature search to determine …
In this 2-part inquiry-based lesson, students conduct a literature search to determine the characteristics of the atmospheres of different planets (Venus, Mercury, Mars and Earth). After collecting and analyzing data, student teams design and conduct a controlled physical experiment using a lab apparatus to learn about the interaction of becomes CO², air, and temperature. The resource includes student worksheets, a design proposal, and student questions. Connections to contemporary climate change are addressed. This lesson is the first of four in Topic 4, "How do Atmospheres Affect Planetary Temperatures?" within the resource, Earth Climate Course: What Determines a Planet's Climate?
In this kinesthetic activity, the concept of energy budget is strengthened as …
In this kinesthetic activity, the concept of energy budget is strengthened as students conduct three simulations using play money as units of energy, and students serve as parts of a planetary radiation balance model. Students will determine the energy budget of a planet by manipulating gas concentrations, energy inputs and outputs in the system in this lesson that supports the study of climate on Mars, Mercury, Venus and Earth. The lesson supports understanding of the real-world problem of contemporary climate change. The resource includes a teacher's guide and several student worksheets. This is the second of four activities in the lesson, How do Atmospheres affect planetary temperatures?, within Earth Climate Course: What Determines a Planet's Climate? The resource aims to help students to develop an understanding of our environment as a system of human and natural processes that result in changes that occur over various space and time scales.
In this activity, students simulate the interaction of variables, including carbon dioxide, …
In this activity, students simulate the interaction of variables, including carbon dioxide, in a radiation balance exercise using a spreadsheet-based radiation balance model. Through a series of experiments, students attempt to mimic the surface temperatures of Earth, Mercury, Venus and Mars, and account for the influence of greenhouse gases in atmospheric temperatures. The activity supports inquiry into the real-world problem of contemporary climate change. Student-collected data is needed from activity A in the same module, "How do atmospheres interact with solar energy?" to complete this activity. Included in the resource are several student data sheets and a teacher's guide. This activity is part of module 4, "How do Atmospheres Affect Planetary Temperatures?" in Earth Climate Course: What Determines a Planet's Climate? The course aims to help students to develop an understanding of our environment as a system of human and natural processes that result in changes that occur over various space and time scales.
This set of three videos illustrates how math is used in satellite …
This set of three videos illustrates how math is used in satellite data analysis. The videos feature NASA senior climate scientist Claire Parkinson. Parkinson explains how the Arctic and Antarctic sea ice covers are measured from satellite data and how math is used to determine trends in the data. In the first video, she leads viewers from satellite data collection through obtaining a time series of monthly average sea ice extents for November 1978 – December 2012, for the Arctic and Antarctic. In the second video, she begins with the time series from the first video, removes the seasonal cycle by calculating yearly averages, and proceeds to calculate the slopes of the lines to get trends in the data, revealing decreasing sea ice coverage in the Arctic and increasing sea ice coverage in the Antarctic. In the third video, she uses a more advanced technique to remove the seasonal cycle and shows that the trends are close to the same, whichever method is used. She emphasizes the power of math and that the techniques shown for satellite sea ice data can also be applied to a wide range of data sets.
What happens when asteroids head for Earth? Most don't make it through …
What happens when asteroids head for Earth? Most don't make it through the atmosphere. This comic strip, a supplement to the Hall of Meteorites Educator's Guide, uses detailed cross-section drawings to show what happens when one does.
In this activity, learners explore the size and scale of the universe …
In this activity, learners explore the size and scale of the universe by shrinking cosmic scale in 4 steps, zooming out from the realm of the Earth and Moon to the realm of the galaxies. This informational brochure was designed as a follow-up take-home activity for teen and adult audiences. It can follow informal education activities where participants have experienced related space science programming. This activity allows participants to explore ideas of size and scale in the universe at their own pace.
This is an activity about structures in space. Learners will construct two …
This is an activity about structures in space. Learners will construct two different types of trusses to develop an understanding of engineering design for truss structures and the role of shapes in the strength of structures. For optimum completion - this activity should span 3 class periods to allow the glue on the structures to dry. This is engineering activity 1 of 2 found in the ISS L.A.B.S. Educator Resource Guide.
This is an activity about the orbit of the ISS around the …
This is an activity about the orbit of the ISS around the Earth. Leaners will investigate the relationship between speed, distance, and orbits as they investigate how quickly the ISS can travel to take a picture of an erupting volcano. This is mathematics activity 2 of 2 found in the ISS L.A.B.S. Educator Resource Guide.
This is an activity about orbital mechanics. Learners will investigate how lateral …
This is an activity about orbital mechanics. Learners will investigate how lateral velocity affects the orbit of a spacecraft such as the ISS. Mathematical extensions are provided. This is science activity 1 of 2 found in the ISS L.A.B.S. Educator Resource Guide.
This is a lesson about crystal growth. Leaners will grow a sugar …
This is a lesson about crystal growth. Leaners will grow a sugar crystal and learn how this relates to growing protein crystals in space. The lack of gravity allows scientists on the space station to grow big, almost perfect crystals, which are used to help design new medicines. This is science activity 2 of 2 found in the ISS L.A.B.S. Educator Resource Guide.
No restrictions on your remixing, redistributing, or making derivative works. Give credit to the author, as required.
Your remixing, redistributing, or making derivatives works comes with some restrictions, including how it is shared.
Your redistributing comes with some restrictions. Do not remix or make derivative works.
Most restrictive license type. Prohibits most uses, sharing, and any changes.
Copyrighted materials, available under Fair Use and the TEACH Act for US-based educators, or other custom arrangements. Go to the resource provider to see their individual restrictions.