Read the Fine Print
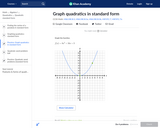
In this Khan Academy activity, students will graph a parabola given its standard form.
- Subject:
- Mathematics
- Material Type:
- Activity/Lab
- Provider:
- Khan Academy
- Date Added:
- 08/28/2018
In this Khan Academy activity, students will graph a parabola given its standard form.
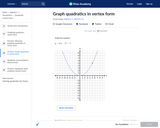
In this Khan Academy activity, students will graph a parabola given its vertex form.
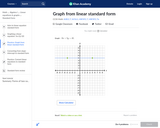
In this Khan Academy activity, students will graph a line from its standard form.
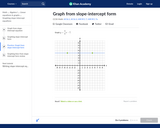
In this Khan Academy activity, students will graph a line from its slope-intercept form.
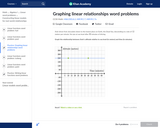
In this Khan Academy activity, students will graph a line from a word problem.

Sample Learning Goals
Describe how changing the coefficients of a quadratic function changes the graph of the function.
Predict how the graph of a parabola will change if the coefficients or constant are varied.
Identify the vertex, axis of symmetry, roots, and directrix for the graph of a quadratic equation.
Use the vertex form of a quadratic function to describe the graph of the function.
Describe the relationship between the focus and directrix and resulting parabola.
Predict the graph of a parabola given a focus and directrix.

Students relate the solutions of a quadratic equation in one variable to the zeros of the function it defines. They sketch graphs of quadratic functions from tables, expressions, and verbal descriptions of relationships in real-world contexts, identifying key features of the quadratic functions from their graphs. Students also graph and show the intercepts and minimum or maximum point.
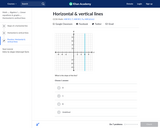
In this Khan Academy activity, students will construct and graph vertical and horizontal lines.
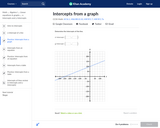
In this Khan Academy activity, students will determine the intercepts of a line.

In this Khan Academy activity, students will determine the intercepts of a line from a table.
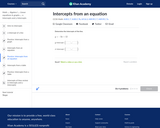
In this Khan Academy activity, students will determine the intercepts of a line from an equation.
Students have been using function notation in various forms and have become more comfortable with features of functions. In this task, the purpose is for students to practice their understanding of the following:
• Distinguish between input and output values when using notation
• Evaluate functions for inputs in their domains
• Determine the solution where the graphs of f(x) and g(x) intersect based on tables of values and by interpreting graphs
• Combine standard function types using arithmetic operations (finding values of f(x)+ g(x))
• Create graphs of functions given conditions.
Sample Learning Goals
Interpret r (the correlation coefficient) as data points are added, moved, or removed.
Interpret the sum of the squared residuals while manually fitting a line.
Interpret the sum of the squared residuals of a best-fit line as a data point is added, moved, or removed.
Compare the sum of the squared residuals between a manually fitted line and the best-fit line.
Determine if a linear fit is appropriate.

Students will extend their study of functions to include function notation and the concepts of domain and range by exploring examples of functions and their graphs, focusing on the contrast between linear and exponential functions. They interpret functions given graphically, numerically, symbolically, and verbally; translate between representations; and understand the limitations of various representations.

In this Khan Academy activity, students will practice problems finding the slope, intercepts, and equation of a line.

In this Khan Academy activity, students will find the slope of a line given its equation.

In this Khan Academy activity, students will find the slope of a line given two points on that line.
This lesson requires students to explore quadratic functions by examining the family of functions described by y = a (x - h)^2 + k. This lesson plan is based on the activity Tremain Nelson used in the video for Part I of this workshop.

This lesson will teach students to factor trinomial expressions of the form x^2 + bx + c. Students will use algebra tiles to identify the binomial factors and the graphing calculator to verify the result. In addition, students will identify the x-intercepts and y-intercepts of each trinomial function and explore relationships between the trinomial x^2 + bx + c and its factored form (x + m)(x + n).