
In this assessment, students describe a set of data using the median, mean, and range.
- Subject:
- Mathematics
- Material Type:
- Assessment
- Provider:
- Howard County Public Schools
- Author:
- Howard County Public Schools
- Date Added:
- 04/23/2014

In this assessment, students describe a set of data using the median, mean, and range.

In this assessment, students describe a set of data using the median, mean, and range.

In this assessment, students describe a set of data using the median, mean, and range.
This is a task from the Illustrative Mathematics website that is one part of a complete illustration of the standard to which it is aligned. Each task has at least one solution and some commentary that addresses important aspects of the task and its potential use.
This is a task from the Illustrative Mathematics website that is one part of a complete illustration of the standard to which it is aligned. Each task has at least one solution and some commentary that addresses important aspects of the task and its potential use.
This is a task from the Illustrative Mathematics website that is one part of a complete illustration of the standard to which it is aligned. Each task has at least one solution and some commentary that addresses important aspects of the task and its potential use.

This parent guide supports parents in helping their child at home with the 6th grade Math content.

This resource accompanies our Rethink 6th Grade Math course. It includes ideas for use, ways to support exceptional children, ways to extend learning, digital resources and tools, tips for supporting English Language Learners and students with visual and hearing impairments. There are also ideas for offline learning.

In this activity, students conduct an investigation to determine which of four chocolate candies is preferred. Each student will taste one each of four candies and will rate them from most to least favorite. Students will then construct a picture graph and a bar graph to determine which types of chocolate were selected as the most and least favorite. Students will also generate a method to decide which candy was the overall class favorite. Conclusions are drawn based on the analysis in the context of the question(s) asked.

This lesson from Illuminations illustrates how weather data can be collected and examined. In the first part, Collecting and Examining Weather Data, students organize and then examine data that has been collected over a period of time in a spreadsheet. In the second part, Representing and Interpreting Data, students use the graphing functions of a spreadsheet to help them interpret data.

Students will build and launch Magnus Effect gliders and measure the distance they fly. They will analyze the data to judge which material gives the glider the most distance. Then they may do the same process for other variables.
In this unit plan, students will be able to answer the following essential questions: 1. How much time should the average fifth-grade student spend on homework to make good grades? 2. Which types of graphs are appropriate for the different kinds of data? 3. How are the different statistical measures (range and measures of central tendency) used to interpret the data?
Students collect data on the number of raisins in 17 boxes of raisins. They will use the data to analyze data and interprete results, answer a series of questions about variation, and construct data in plots.
This is a task from the Illustrative Mathematics website that is one part of a complete illustration of the standard to which it is aligned. Each task has at least one solution and some commentary that addresses important aspects of the task and its potential use.
This is a task from the Illustrative Mathematics website that is one part of a complete illustration of the standard to which it is aligned. Each task has at least one solution and some commentary that addresses important aspects of the task and its potential use.
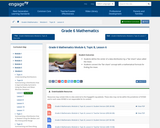
In this lesson, students define the center of a data distribution by a "fair share" value called the mean. Students connect the "fair share" concept with a mathematical formula for finding the mean.

Students will research the ten day weather forecast. They will document the high's for ten days as well as the low's for ten days. Once students document this information, they will find the mean, median, mode, and range of the data collected.
In this module, students move from simply representing data into analysis of data. Students begin to think and reason statistically, first by recognizing a statistical question as one that can be answered by collecting data. Students learn that the data collected to answer a statistical question has a distribution that is often summarized in terms of center,

This is a task from the Illustrative Mathematics website that is one part of a complete illustration of the standard to which it is aligned. Each task has at least one solution and some commentary that addresses important aspects of the task and its potential use.

This is a task from the Illustrative Mathematics website that is one part of a complete illustration of the standard to which it is aligned. Each task has at least one solution and some commentary that addresses important aspects of the task and its potential use.