This is a task from the Illustrative Mathematics website that is one …
This is a task from the Illustrative Mathematics website that is one part of a complete illustration of the standard to which it is aligned. Each task has at least one solution and some commentary that addresses important aspects of the task and its potential use.
Students will create videos that convince the rest of the 6th graders …
Students will create videos that convince the rest of the 6th graders that math is allaround them by doing activities that they love. Students will gather data, create dotplots, histograms and box-and-whisker plots to display data.
This resource accompanies our Rethink 6th Grade Math course. It includes ideas …
This resource accompanies our Rethink 6th Grade Math course. It includes ideas for use, ways to support exceptional children, ways to extend learning, digital resources and tools, tips for supporting English Language Learners and students with visual and hearing impairments. There are also ideas for offline learning.
The Advanced Data Grapher can be used to analyze data with box …
The Advanced Data Grapher can be used to analyze data with box plots, bubble graphs, scatterplots, histograms, and stem-and-leaf plots. You can enter multiple rows and columns of data, select which set(s) to display in a graph, and choose the type of representation.
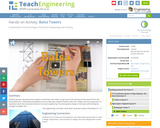
Students groups use balsa wood and glue to build their own towers …
Students groups use balsa wood and glue to build their own towers using some of the techniques they learned from the associated lesson. While general guidelines are provided, give students freedom with their designs and encourage them to implement what they have learned about structural engineering. The winning team design is the tower with the highest strength-to-weight ratio.
Using gumdrops and toothpicks, students conduct a large-group, interactive ozone depletion model. …
Using gumdrops and toothpicks, students conduct a large-group, interactive ozone depletion model. Students explore the dynamic and competing upper atmospheric roles of the protective ozone layer, the sun's UV radiation and harmful human-made CFCs (chlorofluorocarbons).
Students learn about material properties, and that engineers must consider many different …
Students learn about material properties, and that engineers must consider many different materials properties when designing. This activity focuses on strength-to-weight ratios and how sometimes the strongest material is not always the best material.
In this lesson, students examine the structure and function of the human …
In this lesson, students examine the structure and function of the human eye, learning some amazing features about our eyes, which provide us with sight and an understanding of our surroundings. Students also learn about some common eye problems and the biomedical devices and medical procedures that resolve or help to lessen the effects of these vision deficiencies, including vision correction surgery.
In this lesson, students are given a box plot to summarize the …
In this lesson, students are given a box plot to summarize the data by the 5-number summary (Min, Q1, Median, Q3, Max.) and describe a set of data using the 5-number summary and the interquartile range. Students also construct a box plot from a 5-number summary.
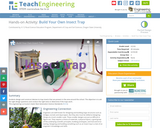
Students design and construct devices to trap insects that are present in …
Students design and construct devices to trap insects that are present in the area around the school. The objective is to ask the right design questions and conduct the right tests to determine if the traps work .
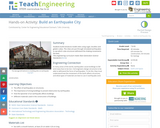
Students build miniature model cities using sugar, bouillon and gelatin cubes. The …
Students build miniature model cities using sugar, bouillon and gelatin cubes. The cities are put through simulated earthquakes to see which cube structures withstand the shaking movements the best.
In this activity, students conduct an investigation to determine which of four …
In this activity, students conduct an investigation to determine which of four chocolate candies is preferred. Each student will taste one each of four candies and will rate them from most to least favorite. Students will then construct a picture graph and a bar graph to determine which types of chocolate were selected as the most and least favorite. Students will also generate a method to decide which candy was the overall class favorite. Conclusions are drawn based on the analysis in the context of the question(s) asked.
This lesson from Illuminations illustrates how weather data can be collected and …
This lesson from Illuminations illustrates how weather data can be collected and examined. In the first part, Collecting and Examining Weather Data, students organize and then examine data that has been collected over a period of time in a spreadsheet. In the second part, Representing and Interpreting Data, students use the graphing functions of a spreadsheet to help them interpret data.
This document provides sample performance tasks/assessment items for Common Core State Standards …
This document provides sample performance tasks/assessment items for Common Core State Standards Grade 6 Math provided by the Louisiana Department of Eduation. Both questions and exemplary responses are included.
Students will build and launch Magnus Effect gliders and measure the distance …
Students will build and launch Magnus Effect gliders and measure the distance they fly. They will analyze the data to judge which material gives the glider the most distance. Then they may do the same process for other variables.
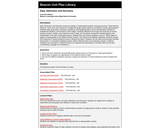
In this unit plan, students will be able to answer the following …
In this unit plan, students will be able to answer the following essential questions: 1. How much time should the average fifth-grade student spend on homework to make good grades? 2. Which types of graphs are appropriate for the different kinds of data? 3. How are the different statistical measures (range and measures of central tendency) used to interpret the data?
Students collect data on the number of raisins in 17 boxes of …
Students collect data on the number of raisins in 17 boxes of raisins. They will use the data to analyze data and interprete results, answer a series of questions about variation, and construct data in plots.
No restrictions on your remixing, redistributing, or making derivative works. Give credit to the author, as required.
Your remixing, redistributing, or making derivatives works comes with some restrictions, including how it is shared.
Your redistributing comes with some restrictions. Do not remix or make derivative works.
Most restrictive license type. Prohibits most uses, sharing, and any changes.
Copyrighted materials, available under Fair Use and the TEACH Act for US-based educators, or other custom arrangements. Go to the resource provider to see their individual restrictions.