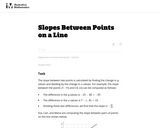
This is a task from the Illustrative Mathematics website that is one …
This is a task from the Illustrative Mathematics website that is one part of a complete illustration of the standard to which it is aligned. Each task has at least one solution and some commentary that addresses important asects of the task and its potential use. Here are the first few lines of the commentary for this task: The slope between two points is calculated by finding the change in $y$-values and dividing by the change in $x$-values. For example, the slope between...
The Common Core State Standards (CCSS) videos are designed to support states, …
The Common Core State Standards (CCSS) videos are designed to support states, schools, and teachers in the implementation of selected math standards. Each video is an audiovisual resource that focuses on one or more specific standards through examples and illustrations geared to enhancing understanding. The intent of each content-focused video is to clarify the meaning of the individual standard rather than to be a guide on how to teach each standard, although the examples can be adapted for instructional use.
This 8th grade Math parent guide explains the content in straightforward terms so they …
This 8th grade Math parent guide explains the content in straightforward terms so they can support their children’s learning at home and will encourage caretaker engagement with lessons.
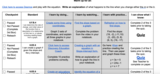
Our Teacher Guides are meant to support the use of our online …
Our Teacher Guides are meant to support the use of our online course and unit content. Please use these to accompany the use of our content and for ideas to support struggling learners, those needing extension and for additional resources.
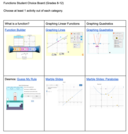
Students will complete a Functions Choice Board they will have two options …
Students will complete a Functions Choice Board they will have two options from each section. What is a function, graphing linear functions and Graphing Quadratic.
In this interactive, web-based game, students must determine the slope-intercept form of …
In this interactive, web-based game, students must determine the slope-intercept form of a line to destroy cockroaches marching across the coordinate grid.
In CK-12 Middle School Math Concepts Grade 8, the learning content is …
In CK-12 Middle School Math Concepts Grade 8, the learning content is divided into concepts. Each concept is complete and whole providing focused learning on an indicated objective. Theme-based concepts provide students with experiences that integrate the content of each concept. Students are given opportunities to practice the skills of each concept through real-world situations, examples, guided practice and explore more practice. There are also video links provided to give students an audio/visual way of connecting with the content.
In this lesson, students determine a linear function given a verbal description …
In this lesson, students determine a linear function given a verbal description of a linear relationship between two quantities. Students interpret linear functions based on the context of a problem. Students graph linear functions by constructing a table of values, plotting points, and drawing the line.
In this lesson, students show that the slope of a line joining …
In this lesson, students show that the slope of a line joining any two distinct points of the graph of y = mx + b has slope, m. Students transform the standard form of an equation into y = -(a/b)x + (c/b).
This packet contains a curriculum-embedded Common Core?aligned task and instructional supports. The …
This packet contains a curriculum-embedded Common Core?aligned task and instructional supports. The task is embedded in a 2?3 week unit on proportional relationships, linear equations, and slopes. In this unit, students will build on previous work with proportional relationships and unit rates. Students will deepen their understanding of functions and linear equations. In this series of tasks, students will graph proportional relationships and interpret the unit rate as the slope of the line. In addition to deriving and interpreting the equation y = mx + b, students will construct a function to model a linear relationship between two quantities. Students will also explore similar triangles and use them to explain why the slope is constant between any two points on a given line.
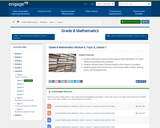
Students will extend what they already know about unit rates and proportional …
Students will extend what they already know about unit rates and proportional relationships to linear equations and their graphs. Students understand the connections between proportional relationships, lines, and linear equations in this module.
In this lesson, students know the definition of constant rate in varied …
In this lesson, students know the definition of constant rate in varied contexts as expressed using two variables where one is t representing a time interval. Students graph points on a coordinate plane related to constant rate problems.
In this lesson, students prove that any point on the graph of …
In this lesson, students prove that any point on the graph of y = mx + b is on a line l and that any point on a line l is a point on the graph of y = mx + b. Students graph linear equations on the coordinate plane.
In this lesson, students know that two equations in the form of …
In this lesson, students know that two equations in the form of ax + by = c and a'x + b'y = c' graph as the same line when a'/a = b'/b = c'/c and at least one of a or b is nonzero. Students know that the graph of a linear equation ax + by = c, where a, b, and c are constants and at least one of a or b is nonzero, is the line defined by the equation ax + by = c.
Sample Learning Goals Explain how the slope of a graphed line can …
Sample Learning Goals Explain how the slope of a graphed line can be computed. Graph a line given an equation in either slope-intercept or point-slope form. Write an equation in slope-intercept or point-slope form given a graphed line. Predict how changing variables in a linear equation will affect the graphed line.
Students will participate in this discovery activity intended for them to uncover …
Students will participate in this discovery activity intended for them to uncover the role each variable plays in the graph of a line in the form y = mx + b. Students will actually demonstrate lines in slope intercept form on a life size graph. They will compare different graphs to see what effect adding negative signs and coefficients to the variables have on the graph. They will also analysis what happens to the graph when a constant is added or subtracted from the variable.
No restrictions on your remixing, redistributing, or making derivative works. Give credit to the author, as required.
Your remixing, redistributing, or making derivatives works comes with some restrictions, including how it is shared.
Your redistributing comes with some restrictions. Do not remix or make derivative works.
Most restrictive license type. Prohibits most uses, sharing, and any changes.
Copyrighted materials, available under Fair Use and the TEACH Act for US-based educators, or other custom arrangements. Go to the resource provider to see their individual restrictions.