This is a task from the Illustrative Mathematics website that is one …
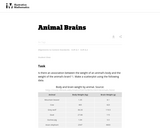
This is a task from the Illustrative Mathematics website that is one part of a complete illustration of the standard to which it is aligned. Each task has at least one solution and some commentary that addresses important asects of the task and its potential use. Here are the first few lines of the commentary for this task: Is there an association between the weight of an animal’s body and the weight of the animal’s brain? 1. Make a scatterplot using the following data. Bo...
This 8th grade Math parent guide explains the content in straightforward terms so they …
This 8th grade Math parent guide explains the content in straightforward terms so they can support their children’s learning at home and will encourage caretaker engagement with lessons.
Our Teacher Guides are meant to support the use of our online …
Our Teacher Guides are meant to support the use of our online course and unit content. Please use these to accompany the use of our content and for ideas to support struggling learners, those needing extension and for additional resources.
The Common Core State Standards (CCSS) videos are designed to support states, …
The Common Core State Standards (CCSS) videos are designed to support states, schools, and teachers in the implementation of selected math standards. Each video is an audiovisual resource that focuses on one or more specific standards through examples and illustrations geared to enhancing understanding. The intent of each content-focused video is to clarify the meaning of the individual standard rather than to be a guide on how to teach each standard, although the examples can be adapted for instructional use.
The Advanced Data Grapher can be used to analyze data with box …
The Advanced Data Grapher can be used to analyze data with box plots, bubble graphs, scatterplots, histograms, and stem-and-leaf plots. You can enter multiple rows and columns of data, select which set(s) to display in a graph, and choose the type of representation.
Students are introduced to measuring and identifying sources of air pollution, as …
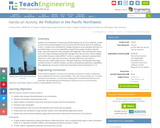
Students are introduced to measuring and identifying sources of air pollution, as well as how environmental engineers try to control and limit the amount of air pollution. In Part 1, students are introduced to nitrogen dioxide as an air pollutant and how it is quantified. Major sources are identified, using EPA bar graphs. Students identify major cities and determine their latitudes and longitudes. They estimate NO2 values from color maps showing monthly NO2 averages from two sources: a NASA satellite and the WSU forecast model AIRPACT. In Part 2, students continue to estimate NO2 values from color maps and use Excel to calculate differences and ratios to determine the model's performance. They gain experience working with very large numbers written in scientific notation, as well as spreadsheet application capabilities.
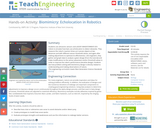
Students learn that fats found in the foods we eat are not …
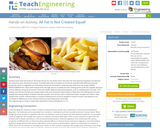
Students learn that fats found in the foods we eat are not all the same; they discover that physical properties of materials are related to their chemical structures. Provided with several samples of commonly used fats with different chemical properties (olive oil, vegetable oil, shortening, animal fat and butter), student groups build and use simple LEGO MINDSTORMS(TM) NXT robots with temperature and light sensors to determine the melting points of the fat samples. Because of their different chemical structures, these fats exhibit different physical properties, such as melting point and color. This activity uses the fact that fats are opaque when solid and translucent when liquid to determine the melting point of each sample upon being heated. Students heat the samples, and use the robot to determine when samples are melted. They analyze plots of their collected data to compare melting points of the oil samples to look for trends. Discrepancies are correlated to differences in the chemical structure and composition of the fats.
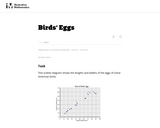
This task asks students to glean contextual information about bird eggs from …
This task asks students to glean contextual information about bird eggs from a collection of measurements of said eggs organized in a scatter plot. In particular, students are asked to identify a correlation and use it to make interpolative predictions, and reason about the properties of specific eggs via the graphical presentation of the data.
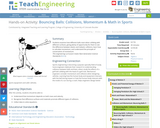
Students examine how different balls react when colliding with different surfaces, giving …
Students examine how different balls react when colliding with different surfaces, giving plenty of opportunity for them to see the difference between elastic and inelastic collisions, learn how to calculate momentum, and understand the principle of conservation of momentum.
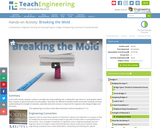
In this math activity, students conduct a strength test using modeling clay, …
In this math activity, students conduct a strength test using modeling clay, creating their own stress vs. strain graphs, which they compare to typical steel and concrete graphs. They learn the difference between brittle and ductile materials and how understanding the strength of materials, especially steel and concrete, is important for engineers who design bridges and structures.
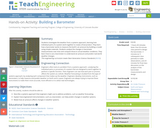
Students investigate the weather from a systems approach, learning how individual parts …
Students investigate the weather from a systems approach, learning how individual parts of a system work together to create a final product. Students learn how a barometer works to measure the Earth's air pressure by building a model using simple materials. Students analyze the changes in barometer measurements over time and compare those to actual weather conditions. They learn how to use a barometer to understand air pressure and predict actual weather changes.
In this lesson students learn to model a real-life situation by collecting …
In this lesson students learn to model a real-life situation by collecting data from a few trials, graphing the data, and then drawing a line of best fit that can be used to make predictions.
This lab demonstrates Ohm's law as students set up simple circuits each …
This lab demonstrates Ohm's law as students set up simple circuits each composed of a battery, lamp and resistor. Students calculate the current flowing through the circuits they create by solving linear equations. After solving for the current, I, for each set resistance value, students plot the three points on a Cartesian plane and note the line that is formed. They also see the direct correlation between the amount of current flowing through the lamp and its brightness.
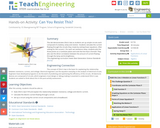
Students observe the relationship between the angle of a catapult (a force …
Students observe the relationship between the angle of a catapult (a force measurement) and the flight of a cotton ball. They learn how Newton's second law of motion works by seeing directly that F = ma. When they pull the metal "arm" back further, thus applying a greater force to the cotton ball, it causes the cotton ball to travel faster and farther. Students also learn that objects of greater mass require more force to result in the same distance traveled by a lighter object.
In a multi-week experiment, students monitor the core temperatures of two compost …
In a multi-week experiment, students monitor the core temperatures of two compost piles, one control and one tended, to see how air and water affect microbial activity. They daily aerate and wet the "treated" pile and collect 4-6 weeks' worth of daily temperature readings. Once the experiment is concluded, students plot and analyze their data to compare the behavior of the two piles. They find that the treated pile becomes hotter, an indication that more microbes are active and releasing heat. Through this activity, students see that microbes play a role in composting and how composting can be used as a carbon management process.
With the help of simple, teacher-led demonstration activities, students learn the basic …
With the help of simple, teacher-led demonstration activities, students learn the basic concepts of heat transfer by means of conduction, convection, and radiation. Students then apply these concepts as they work in teams to solve two problems. One problem requires that they maintain the warm temperature of one soda can filled with water at approximately body temperature, and the other problem is to cause an identical soda can of warm water to cool as much as possible during the same thirty-minute time interval. Students design their solutions using only common, everyday materials. They record the water temperatures in their two soda cans every five minutes, and prepare line graphs in order to visually compare their results to the temperature of an unaltered control can of water.
Student groups are given a set of materials: cardboard, insulating materials, aluminum …
Student groups are given a set of materials: cardboard, insulating materials, aluminum foil and Plexiglas, and challenged to build solar ovens. The ovens must collect and store as much of the sun's energy as possible. Students experiment with heat transfer through conduction by how well the oven is insulated and radiation by how well it absorbs solar radiation. They test the effectiveness of their designs qualitatively by baking something and quantitatively by taking periodic temperature measurements and plotting temperature vs. time graphs. To conclude, students think like engineers and analyze the solar oven's strengths and weaknesses compared to conventional ovens.
Students learn about the many types of expenses associated with building a …
Students learn about the many types of expenses associated with building a bridge. Working like engineers, they estimate the cost for materials for a bridge member of varying sizes. After making calculations, they graph their results to compare how costs change depending on the use of different materials (steel vs. concrete). They conclude by creating a proposal for a city bridge design based on their findings.
No restrictions on your remixing, redistributing, or making derivative works. Give credit to the author, as required.
Your remixing, redistributing, or making derivatives works comes with some restrictions, including how it is shared.
Your redistributing comes with some restrictions. Do not remix or make derivative works.
Most restrictive license type. Prohibits most uses, sharing, and any changes.
Copyrighted materials, available under Fair Use and the TEACH Act for US-based educators, or other custom arrangements. Go to the resource provider to see their individual restrictions.