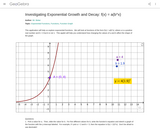
Interactive geogebra activity all about geometric growth and decay.
- Subject:
- Mathematics
- Material Type:
- Interactive
- Provider:
- GeoGebra
- Date Added:
- 05/30/2018

Interactive geogebra activity all about geometric growth and decay.

This task asks students to describe features of a graph. It provides an opportunity to introduce (or use) mathematical terminology that makes communication easier and more precise, such as: periodic behavior, maxima, minima, outliers, increasing, decreasing, slope.

Lesson where students work together to organize data and analyze effects of extreme data points.

Lesson with examples on combining linear expressions.

In this Khan Academy activity, students will evaluate linear equations from words problems.

In this Khan Academy activity, students will construct linear equations from a graph.
Texas Instruments activity involving slope as rate of change.
Texas Instruments Activity graphing inequalities and shading solutions.

In this Khan Academy activity, students will answer questions about a linear word problem.

Class worksheet on how to determine is data is best represented with a linear, quadratic or exponential equation and why.

Unit explaining difference between linear, quadratic and exponential functions with examples.

Students compare linear and exponential models by focusing on how the models change over intervals of equal length. Students observe from tables that a function that grows exponentially eventually exceeds a function that grows linearly.

Students will learn how to apply knowledge of functions to mathematically describe real-life situations
and objects.

Useful problem sets that involve both linear and exponential word problems.

Practice worksheet defining linear versus exponential functions and the differences between the two.

In this Khan Academy activity, students will determine which model, exponential or linear, fits a word problem.

Activity that shows students when linear and when exponential equations are necessary in word problems.

Puzzles solving quadratic equations by factoring and taking the square root. Answers provided.
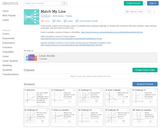
In this activity, students work through a series of scaffolded linear graphing challenges to develop their proficiency with direct variation, slope-intercept, point-slope, and other linear function forms.

Math 1 Statistics Project to assess students' knowledge of basic statistical information, and how to analyze their data. Students will be asking 20 students (or more if so desired by teacher) a question of their choice from a provided list. Students will then use their data to find mean, median, mode, range, and outliers; create a histogram and a box and whisker plot; and analyze their data by answering reflection questions. This project can bse used as a final test grade for a Math 1 statistics unit.