This is an activity about the properties and characteristics of Earth’s magnetic …
This is an activity about the properties and characteristics of Earth’s magnetic field as shown through magnetometer data and its 3D vector nature. This resource builds understanding of conceptual tools such as the addition of vectors and interpreting contour maps displaying magnetic signature data. Learners will make several paper 3D vector addition models, watch podcasts on how to analyze magnetometer data, and employ 3D vector plots to create a model of the 3D magnetic field in the location of the magnetometer closest to their town. This is a multi-step activity with corresponding worksheets for each step. The activity uses data from the THEMIS (Time History of Events and Macroscale Interactions during Substorms) GEONS magnetometer, and requires the use of a computer with internet access and speakers, 2-inch polystyrene balls and bamboo skewers. This is activity 16 from Exploring Magnetism: Earth's Magnetic Personality.
This is a model for students to assemble, aimed at enhancing their …
This is a model for students to assemble, aimed at enhancing their knowledge of NASA spacecraft and scientific facts. The cover contains background information about the Thermosphere, Ionosphere, Mesosphere Energetics and Dynamics (TIMED) mission as well as two language arts activities to reinforce space science vocabulary and concepts.
This is an article about detecting gravitational waves. Learners can read about …
This is an article about detecting gravitational waves. Learners can read about how the Laser Interferometer Space Antenna (LISA) is detecting gravitational waves. An activity is included about how to build a mini-LISA and use it to explore the technology behind the instrument.
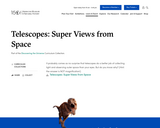
It probably comes as no surprise that telescopes do a better job …
It probably comes as no surprise that telescopes do a better job of collecting light and observing outer space than your eyes. But do you know why? (Hint: the answer is NOT magnification!) This Moveable Museum article, available as a nine-page printable PDF file, offers a thorough, kid-friendly look at telescopes. It discusses how different types of telescopes work and provides some suggested additional resources for further research.
In this activity, student teams design and conduct a scientific investigation in …
In this activity, student teams design and conduct a scientific investigation in which they explore the conditions necessary for life. They conduct observations of environmental conditions both indoor and outdoor, and determine the range of variation they see. They compare these data with published temperature data for Earth, Mars, Pluto and Venus. The activity supports inquiry into the real world challenge of searching for life in extreme environments. The resource includes several student data sheets, data table and images, and a teacher's guide. Materials needed for this activity include weather instruments (e.g., thermometers, barometers, anemometers). This is Activity A of two activities in the first module, titled "Temperature variations and habitability," of the resource, "Earth Climate Course: What Determines a Planet's Climate?" The course aims to help students to develop an understanding of our environment as a system of human and natural processes that result in changes that occur over various space and time scales.
In this activity, student teams create a knowledge map of the essential …
In this activity, student teams create a knowledge map of the essential characteristics or factors of a planet with a habitable climate, identifying range of inputs, outputs and variables of a planetary environmental system. Identified characteristics are compared to extreme environments on Earth, such as the Antarctic or the Sahara desert, and are used to consider the real life challenge of searching for life in extreme environments. The resource includes a student data sheet, questions, teacher's guide and scoring rubric. This is Activity B of two activities in the first module, titled "Temperature variations and habitability," of the resource, Earth Climate Course: What Determines a Planet's Climate? The course aims to help students to develop an understanding of our environment as a system of human and natural processes that result in changes that occur over various space and time scales.
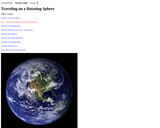
This lesson applies the science and math of the rotation of a …
This lesson applies the science and math of the rotation of a sphere to water and wind movements on Earth. Students are introduced to convection, the Trade Winds and the Coriolis Force. Using an online visualizer, students generate trajectories and then analyze course patterns and latitudinal changes in strength. Note that this is lesson two of five on the Ocean Motion website. Each lesson investigates ocean surface circulation using satellite and model data and can be done independently. See Related URL's for links to the Ocean Motion Website that provide science background information, data resources, teacher material, student guides and a lesson matrix.
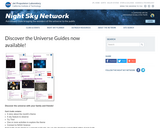
These guides showcase education and public outreach resources from across more than …
These guides showcase education and public outreach resources from across more than 20 NASA astrophysics missions and programs. The twelve guides - one for each month - contain a science topic, an interpretive story, a sky object to view with finding charts, hands-on activities, and connections to NASA science. The guides are modular, so that educators can use the portions that are the most useful for their audiences/events. Following is the theme for each month: January - Betelgeuse, February - Orion Nebula, March - Pleiades, April - Pollux; May - Hubble Deep Field, June - Hercules Cluster, July - Ring Nebula & Veil Nebula, August - The Search for Habitable Worlds, September - Milky Way Galaxy, October - Upsilon Andromedae, November - Andromeda Galaxy, and December - Crab Nebula.
In this activity, students analyze regions of sea ice using data and …
In this activity, students analyze regions of sea ice using data and ImageJ software. They measure ice mass and calculate effective albedo, and plot changes in solar energy and water/ice cover percentages. This is part 4 of a four-part activity on polar science. Data access information is provided in the attached appendix. This activity is one of several learning activities connected with the 2007 GLOBE Earth system poster.
In this activity, student teams learn about research design and design a …
In this activity, student teams learn about research design and design a controlled experiment exploring the relationship between a hypothetical planet, an energy source, and distance. They analyze the data and derive an equation to describe the observations. Includes student data sheets, a teacher's guide, and a tutorial on how to use the spreadsheet program Excel. This is Activity A in module 3, titled "Using Mathematic Models to Investigate Planetary Habitability," of the resource, Earth Climate Course: What Determines a Planet's Climate? The course aims to help students to develop an understanding of our environment as a system of human and natural processes that result in changes that occur over various space and time scales.
In this activity, students build a simple computer model to determine the …
In this activity, students build a simple computer model to determine the black body surface temperature of planets in our solar system: Mercury, Venus, Earth, Mars, Jupiter, Saturn, Uranus, Neptune and Pluto. Experiments altering the luminosity and distance to the light source will allow students to determine the energy reaching the object and its black body temperature. The activity builds on student outcomes from activity A, "Finding a Mathematical Description of a Physical Relationship." It also supports inquiry into a real-world problem, the effect of urban heat islands and deforestation on climate. Includes a teacher's guide, student worksheets, and an Excel tutorial. This is Activity B of module 3, titled "Using Mathematic Models to Investigate Planetary Habitability," of the resource, Earth Climate Course: What Determines a Planet's Climate? The course aims to help students to develop an understanding of our environment as a system of human and natural processes that result in changes that occur over various space and time scales.
Students explore how mathematical descriptions of the physical environment can be fine-tuned …
Students explore how mathematical descriptions of the physical environment can be fine-tuned through testing using data. In this activity, student teams obtain satellite data measuring the Earth's albedo, and then input this data into a spreadsheet-based radiation balance model, GEEBITT. They validate their results against published the published albedo value of the Earth, and conduct similar comparisons Mercury, Venus and Mars. The resource includes an Excel spreadsheet tutorial, an investigation, student data sheets and a teacher's guide. Students apply their understanding to the real life problem of urban heat islands and deforestation. The activity links builds on student outcomes from activities A and B: "Finding a Mathematical Description of a Physical Relationship," and "Making a Simple Mathematical Model." This is Activity C in module 3, Using Mathematical Models to Investigate Planetary Habitability, of the resource, Earth Climate Course: What Determines a Planet's Climate? The course aims to help students to develop an understanding of our environment as a system of human and natural processes that result in changes that occur over various space and time scales.
This is a lesson about the vertical dimension of the atmosphere and …
This is a lesson about the vertical dimension of the atmosphere and includes four activities. Activity 1 Introduces concepts related to distance, including length and height and units of measurement. Students are asked to make comparisons of distances. In activity 2, students learn about the vertical profile of the atmosphere. They work with a graph and plot the heights of objects and the layers of the atmosphere: troposphere, stratosphere, mesosphere, thermosphere, and exosphere. In activity 3, students learn about other forms of visual displays using satellite imagery. They compare images of the same weather feature, a hurricane, using two different images from MODIS and CALIPSO. One image is looking down on the hurricane from space, the other looks through the hurricane to display a profile of the hurricane. Activity 4 reinforces the concept of the vertical nature of the atmosphere. Students will take a CALIPSO satellite image that shows a profile of the atmosphere and use this information to plot mountains and clouds on their own graph of the atmosphere. The recommended order for the activities is to complete the first two activities on day one, and the second two activities on day two. Each day will require approximately 1 to 1.5 hours.
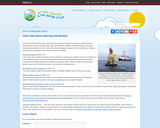
Video clips from federal and regional agencies show scientists at work with …
Video clips from federal and regional agencies show scientists at work with tools used to collect data about the climate and weather. This article, from the free, online magazine Beyond Weather and the Water Cycle, will help students visualize the tools and how they are used in the atmosphere, at sea, and other hard-to-access locations.
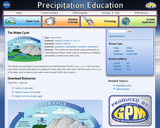
This lesson was developed to give participants an understanding of Earth's water …
This lesson was developed to give participants an understanding of Earth's water cycle. In this one-hour long activity, students participate in a webquest to learn about the water cycle, and then build a mini-model of the water cycle to observe how water moves through Earth's four systems. The activity uses the 5E instructional model and is part of the "Survivor Earth" series of one-hour lessons.
This is an activity about the shape of the Earth’s orbit. Learners …
This is an activity about the shape of the Earth’s orbit. Learners will first use elements of the orbit of Earth and Pluto and an apparatus using string, a pencil, and pushpins to accurately draw an ellipse, showing the nearly circular shape of the orbits of Earth and Pluto. They then measure real images of the Sun in each season, determining the apparent size of the Sun to see if it changes throughout the year. By determining the apparent size of each Sun image and by seeing the shape of Earth's orbit, learners will confront the misconception that seasons are caused by changing distance of the Earth from the Sun. Finally, learners reflect on the results of the Sun-Earth Survey, which is Activity 2 in this set. This is Activity 4 in the Great Explorations in Math and Science (GEMS) guide titled Real Reasons for Seasons: Sun-Earth Connections. The resource guide is available for purchase from the Lawrence Hall of Science. This activity recommends use of an overhead projector.
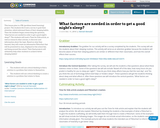
This lesson plan is a PBL (problem based learning) project. The students …
This lesson plan is a PBL (problem based learning) project. The students first took a survey to grab their attention, which informed them of their sleeping habits. Then the students began researching the question, "what factors are needed in order to get a good night's sleep?". The students will read a Time for Kids article, as well as research other articles, to discover new information about the topic. Based on what they learned, they will create an informative Piktochart that will be presented in class, displayed at the school fair, and hung around the school. Their final projects will ultimately help other students to achieve better sleeping habits!
This is an activity about the motion of the Earth around the …
This is an activity about the motion of the Earth around the Sun. Learners will act out the motions of Earth as it orbits around the Sun over the course of one year, starting with modeling one day, then one year, and finally the months.
This site features World Wind 1.3, a NASA Learning Technologies application that …
This site features World Wind 1.3, a NASA Learning Technologies application that lets the user zoom from any satellite altitude into any place on Earth. It features 3D Engine, Blue Marble, Landsat 7, SRTM, Animated Earth, MODIS, GLOBE, Country & State Borders, Place Names, Visual Tools and Landmark Set. The user can download World Wind, reference an online manual, post to an online forum, view screen shot examples from various satellites, and read press coverage about World Wind.
No restrictions on your remixing, redistributing, or making derivative works. Give credit to the author, as required.
Your remixing, redistributing, or making derivatives works comes with some restrictions, including how it is shared.
Your redistributing comes with some restrictions. Do not remix or make derivative works.
Most restrictive license type. Prohibits most uses, sharing, and any changes.
Copyrighted materials, available under Fair Use and the TEACH Act for US-based educators, or other custom arrangements. Go to the resource provider to see their individual restrictions.