
Read the Fine Print
In this resource, students solve two riddles involving quadratics by factoring.
- Subject:
- Mathematics
- Material Type:
- Activity/Lab
- Provider:
- Chandler Unified School Distric
- Date Added:
- 06/07/2018
In this resource, students solve two riddles involving quadratics by factoring.
Students will graph one linear inequality and then graph a system of linear inequalities as they apply to an area of land. Students will practice graphing systems of inequalities and determining if a points lies in the solution. In the extension, students are challenged to write a system of inequalities that describe the area of Mississippi.
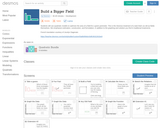
Students will use quadratic models to optimize the area of a field for a given perimeter. This is the Desmos treatment of a task that's as old as fields themselves. We emphasize estimation, construction, and formulation, in addition to the graphing and solution you find in traditional treatments.
Students will apply their knowledge of constructions and finding triangle centers to determine the best location site of a recreation center that will serve three distinct areas within a geographical location.
This lesson unit is intended to help you assess how well students are able to create and solve linear and non-linear equations. In particular, the lesson will help identify and help students who have the following difficulties: • Solving equations where the unknown appears once or more than once. • Solving equations in more than one way

The purpose of this task is to lead students to a numerical and graphical understanding of the behavior of a rational function near a vertical asymptote, in terms of the expression defining the function.
Students will analyze a variety of county-level census data, including on employment, technology, and transportation, in histograms to compare and contrast the shapes of their distributions and to interpret measures of center and spread in context.

This video classifies shapes as quadrilaterals based on slope.

This task has students create equations to model a physical scenario, and then reason with those equations to come up with a solution.
Students will use exponential equations modeling cockroach population.
Students will calculate various measures of central tendency using data on the number of people who bike to work in select states. Students will then create a box plot to represent the data set and answer conceptual questions about the impact of the data set's outlier.
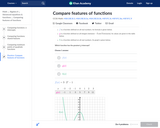
In this Khan Academy activity, students will compare featurs of different functions.
PPT on how to tell the difference between linear, quadratic and exponential functions and the behavior of each.

In this Khan Academy activity, students will compare features of linear functions.

In this Khan Academy activity, students will compare features of quadratic functions.
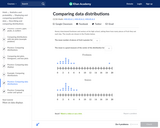
In this Khan Academy activity, students will represent data with plots, interpret differences in shape, center, and spread in the context of the data sets, and examine the effects of extreme data points (outliers) on shape, center, and/or spread.

Students compare two or more distributions in terms of center, variability, and shape; Students interpret a measure of center as a typical value; Students interpret the IQR as a description of the variability of the data; Students answer questions that address differences and similarities for two or more distributions.
Compare properties of two functions each represented in a different way
graphically, numerically in tables, or by verbal descriptions.
Practice worksheet comparing different representations of linear functions.

This video discusses two functions that model the shipment rate of cars. One function is quadratic and the other is exponential. Which one will eventually exceed the other?