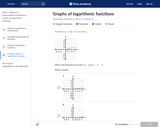
Students study transformations of the graphs of logarithmic functions. Students use the …
Students study transformations of the graphs of logarithmic functions. Students use the properties of logarithms and exponents to produce equivalent forms of exponential and logarithmic expressions. In particular, they notice that different types of transformations can produce the same graph due to these properties.
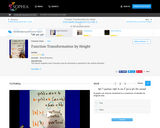
Students explore quadratic functions by using a motion detector known as a …
Students explore quadratic functions by using a motion detector known as a Calculator Based Ranger (CBR) to examine the heights of the different bounces of a ball. Students will represent each bounce with a quadratic function of the form y = a (x - h)^2 + k. This lesson plan is based on the activity Tremain Nelson uses in the video for Part II of this workshop.
Students find a rule that agrees with a giventable. The mathematics task …
Students find a rule that agrees with a giventable. The mathematics task is intended to be a problem or question that encourages the use of mathematical practices. The dialogue is meant to show how students might engage in the mathematical practices as they work on the task.
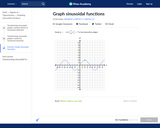
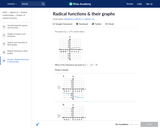
Students examine that a vertical translation of the graph of y = …
Students examine that a vertical translation of the graph of y = f(x) corresponds to changing the equation from y = f(x) to y = f(x) + k and that a vertical scaling of the graph of y = f(x) corresponds to changing the equation from y = f(x) to y = kf(x).
The purpose of this task is to develop strategies for transforming the …
The purpose of this task is to develop strategies for transforming the Ferris wheel functions so that the function and graphs represent different initial starting positions for the rider. Students have already considered vertical translations by moving the center of the Ferris wheel up or down, resulting in the midline of the graph being translated vertically. They have also considered horizontal and vertical dilations of the graph by changing the radius of the Ferris wheel or the speed of rotation, resulting in varying the amplitude or the period of the graph. In this task, horizontal translations of the graph are considered. Students may also note that sine and cosine graphs are interchangeable, as long as the graph is shifted horizontally by an appropriate amount.
Students will extend their study of functions to include function notation and …
Students will extend their study of functions to include function notation and the concepts of domain and range by exploring examples of functions and their graphs, focusing on the contrast between linear and exponential functions. They interpret functions given graphically, numerically, symbolically, and verbally; translate between representations; and understand the limitations of various representations.
The purpose of this task is to examine how changing the parameters …
The purpose of this task is to examine how changing the parameters in a function of the form ℎ(#) = & sin(*#) + , affects the corresponding graph of the function. Students will make connections between the parameters in the equation, the description of the motion of the Ferris wheel, and the amplitude, period and midline of the graph. The midline, which lies halfway between the maximum and minimum points of the graph, depends upon the height of the center of the Ferris wheel and is represented by the value of the parameter d. The amplitude, or distance from the midline to the maximum and minimum points of the graph, depends upon the radius of the Ferris wheel and is represented by the value of the parameter a. The period, or interval before the graph repeats itself, depends upon the length of time of one complete revolution of the wheel. The parameter b represents the angular speed of the wheel—given in terms of degrees per second for this scenario—and is found by dividing 360° by the amount of time it takes to make one complete revolution. Students will observe that the graph is periodic—the rider returns to the same height every 20 seconds. Students should also note the characteristic shape of a sinusoidal graph—the smooth turns rather than sharp points at the maximum and minimum values, for example—and be able to justify the constantly changing slope of the graph in terms of the horizontal and vertical components of motion one experiences when riding on a Ferris wheel.
No restrictions on your remixing, redistributing, or making derivative works. Give credit to the author, as required.
Your remixing, redistributing, or making derivatives works comes with some restrictions, including how it is shared.
Your redistributing comes with some restrictions. Do not remix or make derivative works.
Most restrictive license type. Prohibits most uses, sharing, and any changes.
Copyrighted materials, available under Fair Use and the TEACH Act for US-based educators, or other custom arrangements. Go to the resource provider to see their individual restrictions.