Students will use GLOBE visualizations to display student data on mpas and …
Students will use GLOBE visualizations to display student data on mpas and to learn about seasonal changes in regional and global temperature patterns.
Explore relationships between temperature, pressure, and humidity with daily weather forecasts. GeoInquiries …
Explore relationships between temperature, pressure, and humidity with daily weather forecasts.
GeoInquiries are designed to be fast and easy-to-use instructional resources that incorporate advanced web mapping technology. Each 15-minute activity in a collection is intended to be presented by the instructor from a single computer/projector classroom arrangement. No installation, fees, or logins are necessary to use these materials and software.
In this investigation, students will look at a number of videos, animations, …
In this investigation, students will look at a number of videos, animations, and images in order to gain a better understanding of how hurricanes work. In the first part, students will learn about some of the satellites that researchers use to study and make forecasts about hurricanes. Then students will get a chance to look "under the hood" of a hurricane to see how these storms develop.
In this activity students will learn about advances in computer models and …
In this activity students will learn about advances in computer models and observational methods which have made it possible to learn more about how hurricanes develop.
This activity is designed to guide students through a process-oriented lesson in …
This activity is designed to guide students through a process-oriented lesson in analyzing data from the Tropical Storms - Esri GeoInquiries™ collection for Earth Science at http://www.esri.com/geoinquiries. Students will use storm tracking data from Hurricanes in 2005 to investigate the relationship between pressure and wind, as well as determine and explain the conditions that lead to the development of hurricanes and tropical storms.
This lesson was adapted from the resource: "Tropical storms" Author: GRACE Project Provider: Michigan Virtual Date Added: 11/21/2016 License: Creative Commons Attribution-NonCommercial-ShareAlike 3.0 Language: English Media Format: Text/HTML
This activity is designed to guide students through a process-oriented lesson in …
This activity is designed to guide students through a process-oriented lesson in analyzing data from the Tropical Storms - Esri GeoInquiries™ collection for Earth Science at http://www.esri.com/geoinquiries. Students will use storm tracking data from Hurricanes in 2005 to investigate the relationship between pressure and wind, as well as determine and explain the conditions that lead to the development of hurricanes and tropical storms.
REMIX: Tie-in Impact of storm by looking at specific storm data points before, during and well after US landfall.
This lesson was adapted from the resource: "Tropical storms" Author: GRACE Project Provider: Michigan Virtual Date Added: 11/21/2016 License: Creative Commons Attribution-NonCommercial-ShareAlike 3.0 Language: English Media Format: Text/HTML
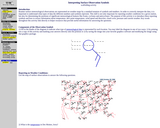
The purpose of this online tutorial activity is to introduce these reporting …
The purpose of this online tutorial activity is to introduce these reporting symbols and how to extract information about temperature, dew point temperature, wind speed and direction, cloud cover, pressure and current weather. Key words throughout this activity link directly to helper resources that provide useful information for answering the questions.
Students will use real maps, images, and data to develop an ozone …
Students will use real maps, images, and data to develop an ozone forecast for a particular day in Charlotte, North Carolina. They will then check their forecast against the actual ozone forecast and measurements for that day. Students should already have experience reading weather maps and forecasting weather before doing this activity.
This site displays a click-and-zoom map of the US showing forecast temperatures …
This site displays a click-and-zoom map of the US showing forecast temperatures as well as several other meteorological variables, normally updated every hour. Also available are maps showing chance of precipitation, temperature and wind, weather, dew point, weather, precipitation, dew point and cover.
In this activity, students will explore their location's climate in order to …
In this activity, students will explore their location's climate in order to inform a pen pal of the type of weather he or she can expect to experience during an upcoming visit. Students will generate and explore a variety of graphs, charts, and map images and interpret them to develop your understanding of normal climate.
In this interdisciplinary lesson, students use a combination of technological skills to …
In this interdisciplinary lesson, students use a combination of technological skills to understand and explain the formation, power, and history of hurricanes.
No restrictions on your remixing, redistributing, or making derivative works. Give credit to the author, as required.
Your remixing, redistributing, or making derivatives works comes with some restrictions, including how it is shared.
Your redistributing comes with some restrictions. Do not remix or make derivative works.
Most restrictive license type. Prohibits most uses, sharing, and any changes.
Copyrighted materials, available under Fair Use and the TEACH Act for US-based educators, or other custom arrangements. Go to the resource provider to see their individual restrictions.