This informational text explains the colorful phenomenon known as the northern lights …
This informational text explains the colorful phenomenon known as the northern lights (aurora borealis) and the southern lights (aurora australis). The text is written at a grade two through three reading level. This version is a full-color PDF that can be printed, cut and folded to form a book. Each book contains color photographs and illustrations.
This activity asks students to reflect on similarities and differences between the …
This activity asks students to reflect on similarities and differences between the following religions and belief systems: Buddhism, Confucianism, Christianity, Hinduism, Islam, Judaism, Shinto, and Daoism. Although not a religion, the philosophical writings of Confucius are included because it is one of the major belief systems that flourished along the Silk Roads.Using quotations from translations of religious texts, students are asked to organize these quotations into broad categories of essential concerns. The quotations will be posted on a silk routes map as reminders of how cultural interchange and belief systems are represented in the ancient and contemporary world.
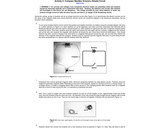
This is an activity about electromagnetism. Learners will set up a simple …
This is an activity about electromagnetism. Learners will set up a simple circuit using a battery, wire, and knife switch, and then use a compass to map the magnetic field lines surrounding the wire. Next, they will add a coil of wire to the simple circuit and map the magnetic fields again. This is the second lesson in the second session of the Exploring Magnetism teachers guide.
This video was created by NCDPI. This video examines best practices and …
This video was created by NCDPI. This video examines best practices and research related to developing computational fluency. Teaching strategies and tips are provided.
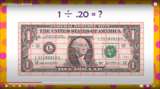
This resources is from Tools4NCTeachers.Conceptual subitizing is recognizing smaller groups and adding them …
This resources is from Tools4NCTeachers.Conceptual subitizing is recognizing smaller groups and adding them together, such as two dots plus two dots equals four dots. This set of dot cards helps students develop their ability to conceptually subitize. Use these with your daily math warm-ups or with any lesson focused around subitizing.
This resource is a colorful inforgraphic on the benefits of biotech crops. …
This resource is a colorful inforgraphic on the benefits of biotech crops. The infographic gives students details on increased crop productivity, conserving biodiversity, reducing agriculture's eco-foodprint and mitigating climate change.
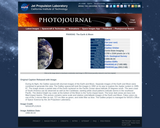
This article introduces a free online collection of images, video clips, and …
This article introduces a free online collection of images, video clips, and animations that teachers can use in creating resources for use with students. The four steps in creating a video clip, an animation, or other resource are presented.
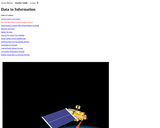
This lesson incorporates sea surface data collected by NASA satellites. Data for …
This lesson incorporates sea surface data collected by NASA satellites. Data for three surface characteristics- height, temperature and speed- are used for several activities. Students examine the differences in speed of currents relative to distance from the Equator. Sea surface data anomalies are charted and further analyzed. In addition, surface current data is presented to examine patterns related to El Niño. Note that this is lesson three of five on the Ocean Motion website. Each lesson investigates ocean surface circulation using satellite and model data and can be done independently. See Related URL's for links to the Ocean Motion Website that provide science background information, data resources, teacher material, student guides and a lesson matrix.
This is an activity about the declining strength of Earth's magnetic field. …
This is an activity about the declining strength of Earth's magnetic field. Learners will review a graph of magnetic field intensity and calculate the amount by which the field has changed its intensity in the last century, the rate of change of its intensity, and when the field should decrease to zero strength at the current rate of change. Learners will also use evidence from relevant sources to create a conjecture on the effects on Earth of a vanished magnetic field. Access to information sources about Earth's magnetic field strength is needed for this activity. This is Activity 7 in the Exploring Magnetism on Earth teachers guide.
This informational text introduces students to the dinosaurs found near the polar …
This informational text introduces students to the dinosaurs found near the polar regions and discusses the adaptations that allowed these dinosaurs to survive in a dark and cold environment. The text is written at a grade two through grade three reading level. This version is a full-color PDF that can be printed, cut and folded to form a book. Each book contains color photographs and illustrations.
This informational text introduces students to the dinosaurs found near the polar …
This informational text introduces students to the dinosaurs found near the polar regions and discusses the adaptations that allowed these dinosaurs to survive in a dark and cold environment. The text is written at a kindergarten through grade one reading level. This version is a full-color PDF that can be printed, cut and folded to form a book. Each book contains color photographs and illustrations.
This informational text introduces students to the dinosaurs found near the polar …
This informational text introduces students to the dinosaurs found near the polar regions and discusses the adaptations that allowed these dinosaurs to survive in a dark and cold environment. The text is written at a grade four through grade five reading level. This version is a full-color PDF that can be printed, cut and folded to form a book. Each book contains color photographs and illustrations.
US adults drank too much and got behind the wheel about 112 …
US adults drank too much and got behind the wheel about 112 million times in 2010. Though episodes of driving after drinking too much ("drinking and driving") have gone down by 30% during the past 5 years, it remains a serious problem in the US. Alcohol-impaired drivers* are involved in about 1 in 3 crash deaths, resulting in nearly 11,000 deaths in 2009. Driving drunk is never OK. Choose not to drink and drive and help others do the same. This resource provides information on the dangers of drinking alcohol and driving.
This is a wallsheet that contains 11 activities relating to Mars. Learners …
This is a wallsheet that contains 11 activities relating to Mars. Learners could investigate: how far away is Mars, why does Mars have craters, water on Mars, Mars' minerals, how high the mountains are on Mars, and are invited to create a martian calendar and travel guide.
This site features earthquake related Flash animations and real video footage. The …
This site features earthquake related Flash animations and real video footage. The visualizations illustrate how seismographs work, p and s waves, earthquake foci versus epicenters, tsunami formation, as well as an earthquake video recorded by security cameras. These resources portray a variety of environments and are suitable for use in lectures, labs, or other teaching activities.
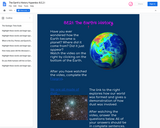
This hyperdoc has the students explore where the Earth came from and …
This hyperdoc has the students explore where the Earth came from and the Geological Time Scale. There are videos, and questions to answer. There is a section with a Flipgrid, you will have to either remove that or change the link to your own Flipgrid.
Remember: Make your own copy for everything to work!
No restrictions on your remixing, redistributing, or making derivative works. Give credit to the author, as required.
Your remixing, redistributing, or making derivatives works comes with some restrictions, including how it is shared.
Your redistributing comes with some restrictions. Do not remix or make derivative works.
Most restrictive license type. Prohibits most uses, sharing, and any changes.
Copyrighted materials, available under Fair Use and the TEACH Act for US-based educators, or other custom arrangements. Go to the resource provider to see their individual restrictions.