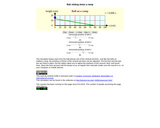
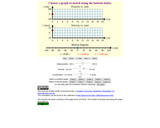
The simulation beeps each time the ball passes one of the vertical …
The simulation beeps each time the ball passes one of the vertical red lines. Just like the bells on Galileo's ramp, the positions of three of the vertical red lines can be adjusted. The first line and the last line are fixed in place, but the sliders allow you to adjust the positions of the second, third, and fourth lines. Move the lines around until the beeps occur at regular time intervals (make sure the sound is on, on your computer or mobile device).
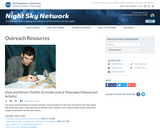
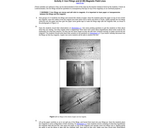
This manual provides simple demonstrations to show how lenses and mirrors are …
This manual provides simple demonstrations to show how lenses and mirrors are used to create telescopes. It was created for use by the Night Sky Network of astronomy clubs.
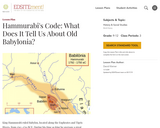
Students learn about life in Babylonia through the lens of Hammurabi's Code. …
Students learn about life in Babylonia through the lens of Hammurabi's Code. This lesson is designed to extend world history curricula on Mesopotamia and to give students a more in-depth view of life in Babylonia during the time of Hammurabi.
The activities and video presented allows the kids to learn about healthy …
The activities and video presented allows the kids to learn about healthy lifestyles and what their future could look like if they were to stat making bad decisions now.
This demonstration shows that an increase in temperature will speed up the …
This demonstration shows that an increase in temperature will speed up the water cycle. One outcome will be an increase in rainfall. A second outcome will be the increase in total evaporation of water and subsequent drought. Materials required include two aquariums, plastic wrap, 2 clamp lamps with 60 watt light bulbs, pebbles and rocks, modeling clay, blue food coloring, and water. Student worksheets, background information for teachers, and a scoring rubric are included. This is Activity 2 in Too Many Blankets, a module in the lesson series, Potential Consequences of Climate Variability and Change.
In this demonstration, students explore the concept of greenhouse warming. They determine …
In this demonstration, students explore the concept of greenhouse warming. They determine whether an increase in the amount of heat-trappping gases in the atmosphere can cause the temperature on Earth to rise. Students compare the relative heat retention in two experimental systems that are identical except for one being covered with plastic wrap. Materials required include two small aquarium tanks, plastic wrap, two clamp lamps with 60 watt bulbs, modeling clay, rocks and pebbles, and two thermometers. Teacher background information, student worksheets and a scoring rubric are included. This is Activity 1 of the module Too Many Blankets, part of the lesson series, The Potential Consequences of Climate Variability and Change.
In this lesson on cosmic rays, students will explain two examples of …
In this lesson on cosmic rays, students will explain two examples of a cosmic ray detector. Includes information about student preconceptions and a demonstration that requires a geiger counter and optional access to a small radioactive source that emits energetic helium nuclei (alpha particles), e.g., the mineral the mineral autunite, which contains uranium. This is activity two of four from The Cosmic Ray Telescope for the Effects of Radiation (CRaTER).
This activity demonstrates Lenz's Law, which states that an induced electromotive force …
This activity demonstrates Lenz's Law, which states that an induced electromotive force generates a current that induces a counter magnetic field that opposes the magnetic field generating the current. In the demonstration, an empty aluminum can floats on water in a tray, such as a Petri dish. Students spin a magnet just inside the can without touching the can. The can begins to spin. Understanding what happens can be explained in steps: first, the twirling magnet creates an alternating magnetic field. Students can use a nearby compass to observe that the magnetic field is really changing. Second, the changing magnetic field permeates most things around it, including the aluminum can itself. A changing magnetic field will cause an electric current to flow when there is a closed loop of an electrically conducting material. Even though the aluminum can is not magnetic, it is metal and will conduct electricity. So the twirling magnet causes an electrical current to flow in the aluminum can. This is called an "induced current." Third, all electric currents create magnetic fields. So, in essence, the induced electrical current running through the can creates its very own magnetic field, making the aluminum can magnetic. This is activity four of "Exploring Magnetism." The guide includes science background information, student worksheets, glossary and related resources.
This is a lesson to demonstrate magnetic field lines in 2- and …
This is a lesson to demonstrate magnetic field lines in 2- and 3-dimensions. In the first activity, learners sprinkle iron filings over a magnet underneath a paper and record their observations. The second activity involves building a 3-D magnetic field visualizer using a clear plastic bottle, a cow magnet and iron filings. This is the second lesson in the first session of the "Exploring Magnetism" teacher guide.
Students can learn to visualize the effects of multiplying a fixed positive …
Students can learn to visualize the effects of multiplying a fixed positive number by positive numbers greater than 1 and less than 1 with this tool. Using interactive figures, students can investigate how changing the height of a rectangle with a fixed width changes its area. e-Math Investigations are selected e-examples from the electronic version of the Principles and Standards of School Mathematics (PSSM). The e-examples are part of the electronic version of the PSSM document. Given their interactive nature and focused discussion tied to the PSSM document, the e-examples are natural companions to the i-Math investigations.
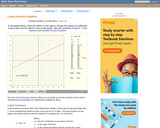
In this two-part example from Illuminations, users can drag a slider on …
In this two-part example from Illuminations, users can drag a slider on an interactive graph to modify a rate of change (cost per minute for phone use) and learn how modifications in that rate affect the linear graph displaying accumulation (the total cost of calls). In this first part, Constant Cost per Minute, the cost per minute for phone use remains constant over time. In the second part, Changing Cost per Minute, the cost per minute for phone use changes after the first sixty minutes of calls. e-Math Investigations are selected e-examples from the electronic version of the Principles and Standards of School Mathematics (PSSM). The e-examples are part of the electronic version of the PSSM document. Given their interactive nature and focused discussion tied to the PSSM document, the e-examples are natural companions to the i-Math investigations.
An interactive applet that allows the user to graphically explore the properties …
An interactive applet that allows the user to graphically explore the properties of a linear functions. Specifically, it is designed to foster an intuitive understanding of the effects of changing the two coefficients in the function y=ax+b. The applet shows a large graph of a quadratic (ax + b) and has two slider controls, one each for the coefficients a and b. As the sliders are moved, the graph is redrawn in real time illustrating the effects of these variations. Applet can be enlarged to full screen size for use with a classroom projector. This resource is a component of the Math Open Reference Interactive Geometry textbook project at http://www.mathopenref.com.
This classroom activity, which centers on documenting the location of a meteorite …
This classroom activity, which centers on documenting the location of a meteorite in Antarctica, introduces students to the technology of Global Positioning Systems. The printable handout includes a series of inquiry-based questions to get students thinking about the challenges of marking exact positions in an area where the landscape is continually changing, illustrated activity directions and a worksheet that guides students through the way satellites are used in GPS and includes areas for recording their findings.
In this short demo/activity, a balloon with baking soda in it is …
In this short demo/activity, a balloon with baking soda in it is stretched over the mouth of a flask or bottle containing vinegar. The balloon is tipped so that the baking soda falls into the vinegar, and the reaction creates carbon dioxide, which inflates the balloon. The activity is part of the children's book, The Air We Breathe.
No restrictions on your remixing, redistributing, or making derivative works. Give credit to the author, as required.
Your remixing, redistributing, or making derivatives works comes with some restrictions, including how it is shared.
Your redistributing comes with some restrictions. Do not remix or make derivative works.
Most restrictive license type. Prohibits most uses, sharing, and any changes.
Copyrighted materials, available under Fair Use and the TEACH Act for US-based educators, or other custom arrangements. Go to the resource provider to see their individual restrictions.