VIDEO 2 OF 3 - This video addresses NC standard 5.NF.1. It …
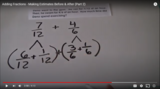
VIDEO 2 OF 3 - This video addresses NC standard 5.NF.1. It explains strategies for making estimates when adding and subtracting fractions with unlike denominators. Strategies for making estimates before and after problems solving are provided.
A web page and interactive applet showing the ways to calculate the …
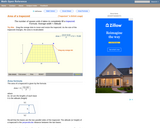
A web page and interactive applet showing the ways to calculate the area of a trapezoid. The user can drag the vertices of the trapezoid and the other points change automatically to ensure it remains a trapezoid. A grid inside the shape allows students to estimate the area visually, then check against the actual computed area. The text on the page gives three different ways to calculate the area with a formula for each. The applet uses one of the methods to compute the area in real time, so it changes as the trapezoid is reshaped with the mouse. A companion page is http://www.mathopenref.com/trapezoid.html showing the definition and properties of a trapezoid. Applet can be enlarged to full screen size for use with a classroom projector. This resource is a component of the Math Open Reference Interactive Geometry textbook project at http://www.mathopenref.com.
In this video segment from Cyberchase, Matt and Inez have to choose …
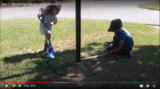
In this video segment from Cyberchase, Matt and Inez have to choose a cage for Spout the Whale. The cages they find in a store come in different sizes and Matt and Inez are not sure of Spout?s exact size. They use estimation and non-standard measurements to estimate Spout's size and select the best cage. Teaching tips are also provided that discuss frame, focus and follow-up suggestions for using this video in a math lesson.
This lesson is Day 1 in a series of 5 lessons around …
This lesson is Day 1 in a series of 5 lessons around U.S customary measurement.
This lesson focuses on measuring lengths to the nearest fourth of a inch, and discusses when it's necessary to find a precise measurement versus an estimate.
This lesson unit is intended to help teachers assess how well students …
This lesson unit is intended to help teachers assess how well students are able to: estimate lengths of everyday objects; convert between decimal and scientific notation; and make comparisons of the size of numbers expressed in both decimal and scientific notation.
This lesson unit is intended to help you assess how well students …
This lesson unit is intended to help you assess how well students are able to: Model a situation; make sensible, realistic assumptions and estimates; and use assumptions and estimates to create a chain of reasoning, in order to solve a practical problem.
In this lesson, students will use mathematical reasoning and the four operations …
In this lesson, students will use mathematical reasoning and the four operations to solve math riddle problems. They will work with a partner to read and discuss the riddle together to figure out the answer and then place in a class book.
In this activity students practice measuring techniques by measuring different objects and …
In this activity students practice measuring techniques by measuring different objects and distances around the classroom. They practice using different scales of measurement in metric units and estimation.
This task allows students to explore a situation involving the estimation, addition, …
This task allows students to explore a situation involving the estimation, addition, and subtraction of fractions with unlike denominators. This is remixable by adding student work or you can upload a new resource also aligned to this standard.
Students determine the coefficient of restitution (or the elasticity) for super balls. …
Students determine the coefficient of restitution (or the elasticity) for super balls. Working in pairs, they drop balls from a meter height and determine how high they bounce. They measure, record and repeat the process to gather data to calculate average bounce heights and coefficients of elasticity. Then they extrapolate to determine the height the ball would bounce if dropped from much higher heights.
Distributions and Variability Type of Unit: Project Prior Knowledge Students should be …
Distributions and Variability
Type of Unit: Project
Prior Knowledge
Students should be able to:
Represent and interpret data using a line plot. Understand other visual representations of data.
Lesson Flow
Students begin the unit by discussing what constitutes a statistical question. In order to answer statistical questions, data must be gathered in a consistent and accurate manner and then analyzed using appropriate tools.
Students learn different tools for analyzing data, including:
Measures of center: mean (average), median, mode Measures of spread: mean absolute deviation, lower and upper extremes, lower and upper quartile, interquartile range Visual representations: line plot, box plot, histogram
These tools are compared and contrasted to better understand the benefits and limitations of each. Analyzing different data sets using these tools will develop an understanding for which ones are the most appropriate to interpret the given data.
To demonstrate their understanding of the concepts, students will work on a project for the duration of the unit. The project will involve identifying an appropriate statistical question, collecting data, analyzing data, and presenting the results. It will serve as the final assessment.
Four full-year digital course, built from the ground up and fully-aligned to …
Four full-year digital course, built from the ground up and fully-aligned to the Common Core State Standards, for 7th grade Mathematics. Created using research-based approaches to teaching and learning, the Open Access Common Core Course for Mathematics is designed with student-centered learning in mind, including activities for students to develop valuable 21st century skills and academic mindset.
Algebraic Reasoning Type of Unit: Concept Prior Knowledge Students should be able …
Algebraic Reasoning
Type of Unit: Concept
Prior Knowledge
Students should be able to:
Add, subtract, multiply, and divide rational numbers. Evaluate expressions for a value of a variable. Use the distributive property to generate equivalent expressions including combining like terms. Understand solving an equation or inequality as a process of answering a question: which values from a specified set, if any, make the equation or inequality true? Write and solve equations of the form x+p=q and px=q for cases in which p, q, and x are non-negative rational numbers. Understand and graph solutions to inequalities x<c or x>c. Use equations, tables, and graphs to represent the relationship between two variables. Relate fractions, decimals, and percents. Solve percent problems included those involving percent of increase or percent of decrease.
Lesson Flow
This unit covers all of the Common Core State Standards for Expressions and Equations in Grade 7. Students extend what they learned in Grade 6 about evaluating expressions and using properties to write equivalent expressions. They write, evaluate, and simplify expressions that now contain both positive and negative rational numbers. They write algebraic expressions for problem situations and discuss how different equivalent expressions can be used to represent different ways of solving the same problem. They make connections between various forms of rational numbers. Students apply what they learned in Grade 6 about solving equations such as x+2=6 or 3x=12 to solving equations such as 3x+6=12 and 3(x−2)=12. Students solve these equations using formal algebraic methods. The numbers in these equations can now be rational numbers. They use estimation and mental math to estimate solutions. They learn how solving linear inequalities differs from solving linear equations and then they solve and graph linear inequalities such as −3x+4<12. Students use inequalities to solve real-world problems, solving the problem first by arithmetic and then by writing and solving an inequality. They see that the solution of the algebraic inequality may differ from the solution to the problem.
Gallery OverviewAllow students who have a clear understanding of the content thus …
Gallery OverviewAllow students who have a clear understanding of the content thus far in the unit to work on Gallery problems of their choosing. You can then use this time to provide additional help to students who need review of the unit's concepts or to assist students who may have fallen behind on work.Gallery DescriptionsFlight of the AlbatrossStudents use estimation to learn about the distances albatrosses fly.SalesStudents use equivalent expressions to solve two-step percent of increase or percent of decrease problems in one step.Carpet CleaningStudents write and solve equations to model the relationship between hours worked and the cost of carpet cleaning.Equations About NumbersStudents write an equation to solve a problem about the sum of three consecutive numbers. Then they write and solve their own problem about the sum of three consecutive numbers.Equations About SportsStudents write and solve equations to solve problems about a basketball game and about walking versus bicycling.Equations About FiguresStudents write and solve equations to model the side lengths and areas of rectangles.A Number TrickStudents use what they know about simplifying algebraic expressions to do number tricks.
Proportional Relationships Type of Unit: Concept Prior Knowledge Students should be able …
Proportional Relationships
Type of Unit: Concept
Prior Knowledge
Students should be able to:
Understand what a rate and ratio are. Make a ratio table. Make a graph using values from a ratio table.
Lesson Flow
Students start the unit by predicting what will happen in certain situations. They intuitively discover they can predict the situations that are proportional and might have a hard time predicting the ones that are not. In Lessons 2–4, students use the same three situations to explore proportional relationships. Two of the relationships are proportional and one is not. They look at these situations in tables, equations, and graphs. After Lesson 4, students realize a proportional relationship is represented on a graph as a straight line that passes through the origin. In Lesson 5, they look at straight lines that do not represent a proportional relationship. Lesson 6 focuses on the idea of how a proportion that they solved in sixth grade relates to a proportional relationship. They follow that by looking at rates expressed as fractions, finding the unit rate (the constant of proportionality), and then using the constant of proportionality to solve a problem. In Lesson 8, students fine-tune their definition of proportional relationship by looking at situations and determining if they represent proportional relationships and justifying their reasoning. They then apply what they have learned to a situation about flags and stars and extend that thinking to comparing two prices—examining the equations and the graphs. The Putting It Together lesson has them solve two problems and then critique other student work.
Gallery 1 provides students with additional proportional relationship problems.
The second part of the unit works with percents. First, percents are tied to proportional relationships, and then students examine percent situations as formulas, graphs, and tables. They then move to a new context—salary increase—and see the similarities with sales taxes. Next, students explore percent decrease, and then they analyze inaccurate statements involving percents, explaining why the statements are incorrect. Students end this sequence of lessons with a formative assessment that focuses on percent increase and percent decrease and ties it to decimals.
Students have ample opportunities to check, deepen, and apply their understanding of proportional relationships, including percents, with the selection of problems in Gallery 2.
Students are asked whether they can determine the number of books in …
Students are asked whether they can determine the number of books in a stack by measuring the height of the stack, or the number of marbles in a collection of marbles by weighing the collection.Students are asked to identify for which situations they can determine the number of books in a stack of books by measuring the height of the stack or the number of marbles in a collection of marbles by weighing the collection.Key ConceptsAs students examine different numerical relationships, they come to understand that they can find the number of books or the number of marbles in situations in which the books are all the same thickness and the marbles are all the same weight. This “constant” is equal to the value BA for a ratio A : B; students begin to develop an intuitive understanding of proportional relationships.Goals and Learning ObjectivesExplore numerical relationshipsSWD: Some students with disabilities will benefit from a preview of the goals in each lesson. Have students highlight the critical features or concepts to help them pay close attention to salient information.
Samples and ProbabilityType of Unit: ConceptualPrior KnowledgeStudents should be able to:Understand the …
Samples and ProbabilityType of Unit: ConceptualPrior KnowledgeStudents should be able to:Understand the concept of a ratio.Write ratios as percents.Describe data using measures of center.Display and interpret data in dot plots, histograms, and box plots.Lesson FlowStudents begin to think about probability by considering the relative likelihood of familiar events on the continuum between impossible and certain. Students begin to formalize this understanding of probability. They are introduced to the concept of probability as a measure of likelihood, and how to calculate probability of equally likely events using a ratio. The terms (impossible, certain, etc.) are given numerical values. Next, students compare expected results to actual results by calculating the probability of an event and conducting an experiment. Students explore the probability of outcomes that are not equally likely. They collect data to estimate the experimental probabilities. They use ratio and proportion to predict results for a large number of trials. Students learn about compound events. They use tree diagrams, tables, and systematic lists as tools to find the sample space. They determine the theoretical probability of first independent, and then dependent events. In Lesson 10 students identify a question to investigate for a unit project and submit a proposal. They then complete a Self Check. In Lesson 11, students review the results of the Self Check, solve a related problem, and take a Quiz.Students are introduced to the concept of sampling as a method of determining characteristics of a population. They consider how a sample can be random or biased, and think about methods for randomly sampling a population to ensure that it is representative. In Lesson 13, students collect and analyze data for their unit project. Students begin to apply their knowledge of statistics learned in sixth grade. They determine the typical class score from a sample of the population, and reason about the representativeness of the sample. Then, students begin to develop intuition about appropriate sample size by conducting an experiment. They compare different sample sizes, and decide whether increasing the sample size improves the results. In Lesson 16 and Lesson 17, students compare two data sets using any tools they wish. Students will be reminded of Mean Average Deviation (MAD), which will be a useful tool in this situation. Students complete another Self Check, review the results of their Self Check, and solve additional problems. The unit ends with three days for students to work on Gallery problems, possibly using one of the days to complete their project or get help on their project if needed, two days for students to present their unit projects to the class, and one day for the End of Unit Assessment.
Students estimate the length of 20 seconds by starting an unseen timer …
Students estimate the length of 20 seconds by starting an unseen timer and stopping it when they think 20 seconds has elapsed. They are shown the results and repeat the process two more times. The first and third times are recorded and compiled, producing two data sets to be compared. Students analyze the data to conclude whether or not their ability to estimate 20 seconds improves with practice.Key ConceptsMeasures of center and spreadLine plots, box plots, and histogramsMean absolute deviation (MAD)Goals and Learning ObjectivesApply knowledge of statistics to compare sets of data.Use measures of center and spread to analyze data.Decide which graph is appropriate for a given situation.
In this activity, students explore the importance of adequate sampling strategies when …
In this activity, students explore the importance of adequate sampling strategies when conducting a scientific investigation. They are tasked with determining the average temperature of the Earth, using data sets easily found on the Internet, and determine the kind and size of sample necessary to calculate a representative average. The resource includes a student data sheet and an authentic assessment for the module, where students discuss the establishment of a habitation site on Mars. This is Activity C in module 2, titled "Modeling Hot and Cold Planets," of the resource, Earth Climate Course: What Determines a Planet's Climate? The course aims to help students to develop an understanding of our environment as a system of human and natural processes that result in changes that occur over various space and time scales.
No restrictions on your remixing, redistributing, or making derivative works. Give credit to the author, as required.
Your remixing, redistributing, or making derivatives works comes with some restrictions, including how it is shared.
Your redistributing comes with some restrictions. Do not remix or make derivative works.
Most restrictive license type. Prohibits most uses, sharing, and any changes.
Copyrighted materials, available under Fair Use and the TEACH Act for US-based educators, or other custom arrangements. Go to the resource provider to see their individual restrictions.