In this part of the unit, students are exploring how global temperatures …
In this part of the unit, students are exploring how global temperatures have changed over the past hundred years. Students will examine tables and graphs about global temperatures and carbon dioxide levels, human consumption of food, and human consumption of natural resources. They will find patterns in the graphs. Based on this data, students will construct an argument about how human activities (increase in population and consumption of natural resources) cause global temperatures to increase.
CK-12 Foundation's Basic Algebra FlexBook is an introduction to the algebraic topics …
CK-12 Foundation's Basic Algebra FlexBook is an introduction to the algebraic topics of functions, equations, and graphs for middle-school and high-school students.
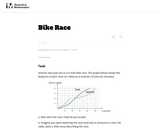
The purpose of this task is for students to interpret two distance-time …
The purpose of this task is for students to interpret two distance-time graphs in terms of the context of a bicycle race. There are two major mathematical aspects to this: interpreting what a particular point on the graph means in terms of the context, and understanding that the "steepness" of the graph tells us something about how fast the bicyclists are moving.
This lesson unit is intended to help teachers assess how well students …
This lesson unit is intended to help teachers assess how well students are able to classify solutions to a pair of linear equations by considering their graphical representations. In particular, this unit aims to help teachers identify and assist students who have difficulties in: using substitution to complete a table of values for a linear equation; identifying a linear equation from a given table of values; and graphing and solving linear equations.
This lesson unit is intended to help teachers assess how well students …
This lesson unit is intended to help teachers assess how well students are able to interpret exponential and linear functions and in particular to identify and help students who have the following difficulties: translating between descriptive, algebraic and tabular data, and graphical representation of the functions; recognizing how, and why, a quantity changes per unit intervale; and to achieve these goals students work on simple and compound interest problems.
This lesson unit is intended to help teachers assess how well students …
This lesson unit is intended to help teachers assess how well students are able to use linear inequalities to create a set of solutions. In particular, the lesson will help teachers identify and assist students who have difficulties in: representing a constraint by shading the correct side of the inequality line; and understanding how combining inequalities affects a solution space.
This lesson unit is intended to help teachers assess how well students …
This lesson unit is intended to help teachers assess how well students are able to understand what the different algebraic forms of a quadratic function reveal about the properties of its graphical representation. In particular, the lesson will help teachers identify and help students who have the following difficulties: understanding how the factored form of the function can identify a graphŐs roots; understanding how the completed square form of the function can identify a graphŐs maximum or minimum point; and understanding how the standard form of the function can identify a graphŐs intercept.
This lesson unit is intended to help you assess how well students …
This lesson unit is intended to help you assess how well students working with square numbers are able to: choose an appropriate, systematic way to collect and organize data, examining the data for patterns; describe and explain findings clearly and effectively; generalize using numerical, geometrical, graphical and/or algebraic structure; and explain why certain results are possible/impossible, moving towards a proof.
The students will be able to identify questions and concepts in the …
The students will be able to identify questions and concepts in the ability to construct accurate graphs, recognize and analyze alternative explanations and models by the end of this activity.
This lesson unit is intended to help teachers assess how well students …
This lesson unit is intended to help teachers assess how well students are able to interpret distanceĐtime graphs and, in particular, to help you identify students who: interpret distanceĐtime graphs as if they are pictures of situations rather than abstract representations of them; and have difficulty relating speeds to slopes of these graphs.
This lesson unit is intended to help teahcers assess how well students …
This lesson unit is intended to help teahcers assess how well students are able to interpret speed as the slope of a linear graph and translate between the equation of a line and its graphical representation.
Rate Type of Unit: Concept Prior Knowledge Students should be able to: …
Rate
Type of Unit: Concept
Prior Knowledge
Students should be able to:
Solve problems involving all four operations with rational numbers. Understand quantity as a number used with a unit of measurement. Solve problems involving quantities such as distances, intervals of time, liquid volumes, masses of objects, and money, and with the units of measurement for these quantities. Understand that a ratio is a comparison of two quantities. Write ratios for problem situations. Make and interpret tables, graphs, and diagrams. Write and solve equations to represent problem situations.
Lesson Flow
In this unit, students will explore the concept of rate in a variety of contexts: beats per minute, unit prices, fuel efficiency of a car, population density, speed, and conversion factors. Students will write and refine their own definition for rate and then use it to recognize rates in different situations. Students will learn that every rate is paired with an inverse rate that is a measure of the same relationship. Students will figure out the logic of how units are used with rates. Then students will represent quantitative relationships involving rates, using tables, graphs, double number lines, and formulas, and they will see how to create one such representation when given another.
In this lesson, students represent quantitative relationships involving rates using tables, graphs, …
In this lesson, students represent quantitative relationships involving rates using tables, graphs, double number lines, and formulas. Students will understand how to create one such representation when given another representation.Key ConceptsQuantitative relationships involving rates can be represented using tables, graphs, double number lines, and formulas. One such representation can be used to create another representation. Two rates can describe each situation: the rate and its inverse. For the water pump situation, there are two related formulas: a formula for finding the quantity of water pumped for any amount of time, and a formula for finding the amount of time for any quantity of water.Goals and Learning ObjectivesUnderstand that tables, graphs, double number lines, and formulas can be used to represent the same situation.Compare the different representations within a situation and the same representation across similar situations.Understand each representation and how to find the rate in each one.
Ratios Type of Unit: Concept Prior Knowledge Students should be able to: …
Ratios
Type of Unit: Concept
Prior Knowledge
Students should be able to:
Calculate with whole numbers up to 100 using all four operations. Understand fraction notation and percents and translate among fractions, decimal numbers, and percents. Interpret and use a number line. Use tables to solve problems. Use tape diagrams to solve problems. Sketch and interpret graphs. Write and interpret equations.
Lesson Flow
The first part of the unit begins with an exploration activity that focuses on a ratio as a way to compare the amount of egg and the amount of flour in a mixture. The context motivates a specific understanding of the use of, and need for, ratios as a way of making comparisons between quantities. Following this lesson, the usefulness of ratios in comparing quantities is developed in more detail, including a contrast to using subtraction to find differences. Students learn to interpret and express ratios as fractions, as decimal numbers, in a:b form, in words, and as data; they also learn to identify equivalent ratios.
The focus of the middle part of the unit is on the tools used to represent ratio relationships and on simplifying and comparing ratios. Students learn to use tape diagrams first, then double number lines, and finally ratio tables and graphs. As these tools are introduced, students use them in problem-solving contexts to solve ratio problems, including an investigation of glide ratios. Students are asked to make connections and distinctions among these forms of representation throughout these lessons. Students also choose a ratio project in this part of the unit (Lesson 8).
The third and last part of the unit covers understanding percents, including those greater than 100%.
Students have ample opportunities to check, deepen, and apply their understanding of ratios, including percents, with the selection of problems in the Gallery.
Students design and work on their projects in class. They review the …
Students design and work on their projects in class. They review the project rubric and, as a class, add criteria relevant to their specific projects.Key ConceptsStudents apply their knowledge about ratios to solve a problem. They represent ratios using models such as tables, tape diagrams, double number lines, or graphs.Goals and Learning ObjectivesUse and interpret ratios to solve a problem.Model ratios—including tables, tape diagrams, double number lines, graphs—to represent a problem situation.Articulate strategies, thought processes, and approaches to solving a problem and defend why the solution is reasonable.
This lesson introduces the concept of a glide ratio and encourages students …
This lesson introduces the concept of a glide ratio and encourages students to use appropriate tools strategically (Mathematical Practice 5). Students use tape diagrams, double number lines, ratio tables, graphs, and equations to represent glide ratios.Key ConceptsA glide ratio for an object or an organism in flight is the ratio of forward distance to vertical distance (in the absence of power and wind). For a given object or organism that glides, this ratio has a constant value and is treated as a feature of the object or organism.Goals and Learning ObjectivesUnderstand the concept of a glide ratio.Make connections within and between different ways of representing ratios.
Students focus on interpreting, creating, and using ratio tables to solve problems. …
Students focus on interpreting, creating, and using ratio tables to solve problems. They also relate ratio tables to graphs as two ways of representing a relationship between quantities.Key ConceptsRatio tables and graphs are two ways of representing relationships between variable quantities. The values shown in a ratio table give possible pairs of values for the quantities represented and define ordered pairs of coordinates of points on the graph representing the relationship. The additive and multiplicative structure of each representation can be connected, as shown: Goals and Learning ObjectivesComplete ratio tables.Use ratio tables to compare ratios and solve problems.Plot values from a ratio table on a graph.Understand the connection between the structure of ratio tables and graphs.
No restrictions on your remixing, redistributing, or making derivative works. Give credit to the author, as required.
Your remixing, redistributing, or making derivatives works comes with some restrictions, including how it is shared.
Your redistributing comes with some restrictions. Do not remix or make derivative works.
Most restrictive license type. Prohibits most uses, sharing, and any changes.
Copyrighted materials, available under Fair Use and the TEACH Act for US-based educators, or other custom arrangements. Go to the resource provider to see their individual restrictions.