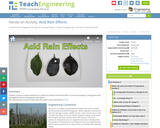
Students conduct a simple experiment to model and explore the harmful effects …
Students conduct a simple experiment to model and explore the harmful effects of acid rain (vinegar) on living (green leaf and eggshell) and non-living (paper clip) objects.
This site features GIFs, Java applets, MPEGs, and Flash animations that illustrate …
This site features GIFs, Java applets, MPEGs, and Flash animations that illustrate various forms of precipitation and moisture. They include an animation of air parcels and water vapor colliding with condensation nuclei which results in condensation and cloud formation, an interactive precipitation animation applet that allows the user to set wet and dry bulb temperatures to see if snow, ice, freezing rain, sleet, super cooled droplets, raindrops, or drizzle will fall, an animation of lake effect snow over the Great Lakes, and infrared satellite images of water vapor moving across the US. These resources portray a variety of environments and are suitable for use in lectures, labs, or other teaching activities.
This lesson from Illuminations illustrates how weather data can be collected and …
This lesson from Illuminations illustrates how weather data can be collected and examined. In the first part, Collecting and Examining Weather Data, students organize and then examine data that has been collected over a period of time in a spreadsheet. In the second part, Representing and Interpreting Data, students use the graphing functions of a spreadsheet to help them interpret data.
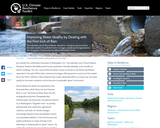
The suburban city of Mount Rainier, Maryland, is doing its part to …
The suburban city of Mount Rainier, Maryland, is doing its part to improve the water quality of a polluted river in its region: residents and organizations are using green infrastructure to reduce stormwater runoff.
Four full-year digital course, built from the ground up and fully-aligned to …
Four full-year digital course, built from the ground up and fully-aligned to the Common Core State Standards, for 7th grade Mathematics. Created using research-based approaches to teaching and learning, the Open Access Common Core Course for Mathematics is designed with student-centered learning in mind, including activities for students to develop valuable 21st century skills and academic mindset.
Samples and ProbabilityType of Unit: ConceptualPrior KnowledgeStudents should be able to:Understand the …
Samples and ProbabilityType of Unit: ConceptualPrior KnowledgeStudents should be able to:Understand the concept of a ratio.Write ratios as percents.Describe data using measures of center.Display and interpret data in dot plots, histograms, and box plots.Lesson FlowStudents begin to think about probability by considering the relative likelihood of familiar events on the continuum between impossible and certain. Students begin to formalize this understanding of probability. They are introduced to the concept of probability as a measure of likelihood, and how to calculate probability of equally likely events using a ratio. The terms (impossible, certain, etc.) are given numerical values. Next, students compare expected results to actual results by calculating the probability of an event and conducting an experiment. Students explore the probability of outcomes that are not equally likely. They collect data to estimate the experimental probabilities. They use ratio and proportion to predict results for a large number of trials. Students learn about compound events. They use tree diagrams, tables, and systematic lists as tools to find the sample space. They determine the theoretical probability of first independent, and then dependent events. In Lesson 10 students identify a question to investigate for a unit project and submit a proposal. They then complete a Self Check. In Lesson 11, students review the results of the Self Check, solve a related problem, and take a Quiz.Students are introduced to the concept of sampling as a method of determining characteristics of a population. They consider how a sample can be random or biased, and think about methods for randomly sampling a population to ensure that it is representative. In Lesson 13, students collect and analyze data for their unit project. Students begin to apply their knowledge of statistics learned in sixth grade. They determine the typical class score from a sample of the population, and reason about the representativeness of the sample. Then, students begin to develop intuition about appropriate sample size by conducting an experiment. They compare different sample sizes, and decide whether increasing the sample size improves the results. In Lesson 16 and Lesson 17, students compare two data sets using any tools they wish. Students will be reminded of Mean Average Deviation (MAD), which will be a useful tool in this situation. Students complete another Self Check, review the results of their Self Check, and solve additional problems. The unit ends with three days for students to work on Gallery problems, possibly using one of the days to complete their project or get help on their project if needed, two days for students to present their unit projects to the class, and one day for the End of Unit Assessment.
Gallery OverviewAllow students who have a clear understanding of the content thus …
Gallery OverviewAllow students who have a clear understanding of the content thus far in the unit to work on Gallery problems of their choosing. You can then use this time to provide additional help to students who need review of the unit's concepts or to assist students who may have fallen behind on work.Chance of RainStudents are given the probability that it will rain on two different days and asked to find the chance that it will rain on one of the two days.PenguinsIn an Antarctic penguin colony, 200 penguins are tagged and released. A year later, 100 penguins are captured and 4 of them are tagged. Students determine how many penguins are in the colony.How Many Yellow?Given the total number of balls in a bag and the probability for two colors, students find the number of balls for the third color.How Many Ways to Line Up?Students decide how many different ways they five students can order themselves as they line up for class.Gumballs There are some white gumballs and red gumballs left in a machine. Students find the probability of getting at least one red gumball.New FamilyA married couple wants to have four children. Students find the probability that at least one child will be a girl.Nickel and DimeStudents find the probability for different outcomes when tossing two coins.Four More FlipsStudents determine how many more tails are likely if a coin has already landed on tails twice.Bubble GumThe letters G, U, or M are printed inside bubble gum wrappers in a ratio of 3:2:1. Students use a simulation to find out how much bubble gum to buy to get a 3:2:1 ratio.A Large FamilyIf a family wants to have six children, what is the probability that there will be three boys and three girls? Students use a simulation to model the probability.No TelephoneUsing census data from 1960 and 1990 in two box plots, students compare the percentages of families that had phones.Pulse RateStudents compare two data sets of different sizes: one for students and one for athletes.Golf ScoresStudents are given two sets of golf scores for Rosa and Chen. They are asked to decide who is the better golfer by constructing and comparing box plots.How Much Taller?Given two sets of data about heights, students determine how much taller one group is than the other.Coin Jar Students determine the contents of a coin jar by sampling.Project Work TimeStudents can choose to work on and complete their project or get help if needed.
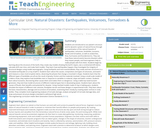
Students are introduced to our planet's structure and its dynamic system of …
Students are introduced to our planet's structure and its dynamic system of natural forces through an examination of the natural hazards of earthquakes, volcanoes, landslides, tsunamis, floods and tornados, as well as avalanches, fires, hurricanes and thunderstorms. They see how these natural events become disasters when they impact people, and how engineers help to make people safe from them. Students begin by learning about the structure of the Earth; they create clay models showing the Earth's layers, see a continental drift demo, calculate drift over time, and make fault models. They learn how earthquakes happen; they investigate the integrity of structural designs using model seismographs. Using toothpicks and mini-marshmallows, they create and test structures in a simulated earthquake on a tray of Jell-O. Students learn about the causes, composition and types of volcanoes, and watch and measure a class mock eruption demo, observing the phases that change a mountain's shape. Students learn that the different types of landslides are all are the result of gravity, friction and the materials involved. Using a small-scale model of a debris chute, they explore how landslides start in response to variables in material, slope and water content. Students learn about tsunamis, discovering what causes them and makes them so dangerous. Using a table-top-sized tsunami generator, they test how model structures of different material types fare in devastating waves. Students learn about the causes of floods, their benefits and potential for disaster. Using riverbed models made of clay in baking pans, students simulate the impact of different river volumes, floodplain terrain and levee designs in experimental trials. They learn about the basic characteristics, damage and occurrence of tornadoes, examining them closely by creating water vortices in soda bottles. They complete mock engineering analyses of tornado damage, analyze and graph US tornado damage data, and draw and present structure designs intended to withstand high winds.
This is the second lesson in the unit Weather Trackers (http://www.beaconlearningcenter.com/unitplan/11468.htm). Students …
This is the second lesson in the unit Weather Trackers (http://www.beaconlearningcenter.com/unitplan/11468.htm). Students have the opportunity to work in groups to draw the rain cycle and make their own "movie" using a large cardboard milk carton and heavy white paper. Students are assessed on their ability to identify the pattern of the rain cycle and to sequence the events in order. Emphasis is placed on the Sun being the source of heat that drives the cycle.
Students learn about physical models of groundwater and how environmental engineers determine …
Students learn about physical models of groundwater and how environmental engineers determine possible sites for drinking water wells. During the activity, students create their own groundwater well models using coffee cans and wire screening. They add red food coloring to their models to see how pollutants can migrate through the groundwater into a drinking water resource.
This encyclopedia entry is for the term "precipitation." Precipitation is any type …
This encyclopedia entry is for the term "precipitation." Precipitation is any type of water that forms in the Earth's atmosphere and then drops onto the surface of the Earth. Water vapor, droplets of water suspended in the air, builds up in the Earth's atmosphere. Text for this entry is appropriate for the middle and high school grade levels.
This is an encyclopedia entry for the term "rain." Rain is liquid …
This is an encyclopedia entry for the term "rain." Rain is liquid precipitation: water falling from the sky. Raindrops fall to Earth when clouds become saturated, or filled, with water droplets. Text for this entry is appropriate for the middle and high school grade levels.
No restrictions on your remixing, redistributing, or making derivative works. Give credit to the author, as required.
Your remixing, redistributing, or making derivatives works comes with some restrictions, including how it is shared.
Your redistributing comes with some restrictions. Do not remix or make derivative works.
Most restrictive license type. Prohibits most uses, sharing, and any changes.
Copyrighted materials, available under Fair Use and the TEACH Act for US-based educators, or other custom arrangements. Go to the resource provider to see their individual restrictions.