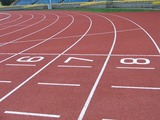
In this lesson, students watch a video of a runner and express …
In this lesson, students watch a video of a runner and express his speed as a rate in meters per second. Students then use the rate to determine how long it takes the runner to go any distance.Key ConceptsSpeed is a rate that is expressed as distance traveled per unit of time. Miles per hour, laps per minute, and meters per second are all examples of units for speed. The measures of speed, distance, and time are all related. The relationship can be expressed in three ways: d = rt, r = dt, t = dr.Goals and Learning ObjectivesExplore speed as a rate that measures the relationship between two aspects of a situation: distance and time.In comparing distance, speed, and time, understand how to use any two of these measures to find the third measure.
In this activity, students will make go-carts and measure the speed, then …
In this activity, students will make go-carts and measure the speed, then change different factors of the experiment and see how the speed changes. In day 1, students will design and build a cart based on a specified set of materials, and then complete several trials to test the cart by rolling it down a ramp. Through discussion and journaling students will share their designs and compare the speeds of carts. In day 2, students will experiment with ways to increase or decrease the speed of their cart.
In this activity, students will observe marbles rolling down a ramp and …
In this activity, students will observe marbles rolling down a ramp and identify variables that could cause the marble to roll faster or farther. They will then design a procedure to test how the height of the ramp affects the motion of the marble and collect, record, and analyze data.
This is a PBL lesson where students explore the Physics behind motion …
This is a PBL lesson where students explore the Physics behind motion of objects. Students will collaborate and come up with a video showing the difference between distance and displacement, speed and velocity and acceleration.
In this STEM lesson, students will use the engineering design process to …
In this STEM lesson, students will use the engineering design process to design and construct rocket-powered racing cars with which to investigate Newton's Laws of Motion. Each student will construct his or her own car from food trays, and will use inflated balloons to power the car (thrust). Students conduct three trials and measure the distance traveled by the cars. Between trials, students modify their designs to improve performance and solve any "mechanical" problems that crop up. At the conclusion of the activity, students submit a report on their racer design and how it performed in the trials.
Students conduct an experiment to determine the relationship between the speed of …
Students conduct an experiment to determine the relationship between the speed of a wooden toy car at the bottom of an incline and the height at which it is released. They observe how the photogate-based speedometer instrument "clocks" the average speed of an object (the train). They gather data and create graphs plotting the measured speed against start height. After the experiment, as an optional extension activity, students design brakes to moderate the speed of the cart at the bottom of the hill to within a specified speed range.
In this lesson, students learn about vocabulary such as gravity, force and …
In this lesson, students learn about vocabulary such as gravity, force and speed, and then apply those meanings as they participate in small cooperative groups to test different variables such as weight, speed and elevation. Students record and compare such data as time it takes for toy cars to roll down a ramp, the distance a toy car travels and they determine the averages for time and distance.
Students see how different levels of surface tension affect water's ability to …
Students see how different levels of surface tension affect water's ability to move. Teams "race" water droplets down tracks made of different materials, making measurements, collecting data, making calculations, graphing results and comparing to their predictions and the properties of each surface, determining which surface exhibits the highest (or lowest) level of surface tension with water. They apply their results to make engineering recommendations for real-world applications.
Students strengthen their communicate skills about measurements by learning the meaning of …
Students strengthen their communicate skills about measurements by learning the meaning of base units and derived units, including speed one of the most common derived units (distance/time). Working in groups, students measure the time for LEGO MINDSTORMS(TM) NXT robots to move a certain distance. The robots are started and stopped via touch sensors and programmed to display the distance traveled. Using their collected data, students complete a worksheet to calculate the robots' (mean/average) speeds at given motor powers.
This applet simulates two runners moving along a track and creates a …
This applet simulates two runners moving along a track and creates a graph of the time-versus-distance relationship of their motion. Students then observe the simulated races as they happen and relate the changing positions of the two runners to dynamic representations that change as the events occur. Students can predict the effects on the graph of changing the starting position or the length of the stride of either runner. They can observe and analyze how a change in one variable, such as length of stride, relates to a change in speed. This computer simulation uses a familiar context that students understand from daily life, and the technology allows them to analyze the relationships in this context deeply because of the ease of manipulating the environment and observing the changes that occur.
Students are introduced to an important engineering element the gear. Different types …
Students are introduced to an important engineering element the gear. Different types of gears are used in many engineering devices, including wind-up toys, bicycles, cars and non-digital clocks. Students learn about various types of gears and how they work in machines. They handle and combine LEGO spur gears as an exercise in gear ratios. They see how gears and different gear train arrangements are used to change the speed, torque and direction of a power source. This prepares them to apply this knowledge in four associated activities in order to create successful solutions to design challenges that use LEGO MINDSTORMS(TM) NXT robots. A PowerPoint® presentation, pre/post quizzes and a worksheet are provided.
Expanding on the topic of objects in motion covering Newton's laws of …
Expanding on the topic of objects in motion covering Newton's laws of motion, acceleration and velocity, which are taught starting in third grade, students are introduced to new concepts of speed, density, level of service (LOS) (quality of roadways), delay and congestion. Every day we are affected by congestion even if we do not step out of our homes. For example, the price we pay for goods increases due to increases in shipping costs caused by congestion delays. A congestion metric would help us to compare roadways and assess improvement methods. A common metric used to measure congestion is called level of service (LOS).
In an interactive and game-like manner, students learn about the mechanical advantage …
In an interactive and game-like manner, students learn about the mechanical advantage that is offered by gears. By virtue of the activity's mechatronics presentation, students learn to study a mechanical system as a dynamic system under their control as opposed to a static image. The system presented is of two motorized racing cars built using the LEGO® MINDSTORMS® robotics platform. The altered variable between the two systems is the gear train; one is geared up for speed and the other is geared down for torque. Students collect and analyze data to reinforce particular aspects and effects of mechanical advantage.
No restrictions on your remixing, redistributing, or making derivative works. Give credit to the author, as required.
Your remixing, redistributing, or making derivatives works comes with some restrictions, including how it is shared.
Your redistributing comes with some restrictions. Do not remix or make derivative works.
Most restrictive license type. Prohibits most uses, sharing, and any changes.
Copyrighted materials, available under Fair Use and the TEACH Act for US-based educators, or other custom arrangements. Go to the resource provider to see their individual restrictions.