This 7th grade Math parent guide explains the content in straightforward terms so they …
This 7th grade Math parent guide explains the content in straightforward terms so they can support their children’s learning at home and will encourage caretaker engagement with lessons.
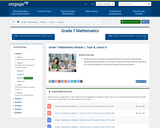
Our Teacher Guides are meant to support the use of our online …
Our Teacher Guides are meant to support the use of our online course and unit content. Please use these to accompany the use of our content and for ideas to support struggling learners, those needing extension and for additional resources.
In this lesson, students identify the same value relating the measures of …
In this lesson, students identify the same value relating the measures of x and the measures of y in a proportional relationship as the constant of proportionality and recognize it as the unit rate in the context of a given situation. Students find and interpret the constant of proportionality within the contexts of problems.
This lesson is designed to wrap up the unit with an assessment …
This lesson is designed to wrap up the unit with an assessment and individual project. Students will complete an short in-class assessment on Unit Rates and Proportions. Students will begin their individual research necessary to complete a global project based on the previous tasks within this unit. This lesson was developed by Elizabeth Hicks as part of their completion of the North Carolina Global Educator Digital Badge program. This lesson plan has been vetted at the local and state level for standards alignment, Global Education focus, and content accuracy.
Students will use global information obtained in previous lessons; such as poverty …
Students will use global information obtained in previous lessons; such as poverty levels, to calculate percent change. Students will develop an understanding "Percent Change" and how to calculate it using proportions. This lesson was developed by Elizabeth Hicks as part of their completion of the North Carolina Global Educator Digital Badge program. This lesson plan has been vetted at the local and state level for standards alignment, Global Education focus, and content accuracy.
The lesson will allow students to work collaboratively to develop and individually …
The lesson will allow students to work collaboratively to develop and individually to develop an understanding of living in poverty. They will research, investigate, and discuss how the national poverty level is calculated. While examining poverty on the local and national level, they will be given the opportunity to use percentages in their calculations. This lesson was developed by Elizabeth Hicks as part of their completion of the North Carolina Global Educator Digital Badge program. This lesson plan has been vetted at the local and state level for standards alignment, Global Education focus, and content accuracy.
In this lesson, students use the context of a word problem to …
In this lesson, students use the context of a word problem to determine which of two quantities represents the whole. Students understand that the whole is 100% and think of one quantity as a percent of another using the formula Quantity = Percent x Whole to problem-solve when given two terms out of three from a quantity, whole, and percent. When comparing two quantities, students compute percent more or percent less using algebraic, numeric, and visual models.
This course was created by the Rethink Education Content Development Team in …
This course was created by the Rethink Education Content Development Team in partnership with the North Carolina Virtual Public Schools. This course is aligned to the NC Standards for 7th Grade Math.
This course was created by the Rethink Education Content Development Team in …
This course was created by the Rethink Education Content Development Team in partnership with the North Carolina Virtual Public Schools. This course is aligned to the NC Standards for 7th Grade Math.
This course was created by the Rethink Education Content Development Team in …
This course was created by the Rethink Education Content Development Team in partnership with the North Carolina Virtual Public Schools. This course is aligned to the NC Standards for 7th Grade Math.
In this lesson, students use the constant of proportionality to represent proportional …
In this lesson, students use the constant of proportionality to represent proportional relationships by equations in real world contexts as they relate the equations to a corresponding ratio table and/or graphical representation.
No restrictions on your remixing, redistributing, or making derivative works. Give credit to the author, as required.
Your remixing, redistributing, or making derivatives works comes with some restrictions, including how it is shared.
Your redistributing comes with some restrictions. Do not remix or make derivative works.
Most restrictive license type. Prohibits most uses, sharing, and any changes.
Copyrighted materials, available under Fair Use and the TEACH Act for US-based educators, or other custom arrangements. Go to the resource provider to see their individual restrictions.