The North Carolina Museum of Natural Science created this resource as part …
The North Carolina Museum of Natural Science created this resource as part of an online workshop series, but you are welcome to use or modify it for your classroom. It includes a video and written directions for creating nature journals and tips for incorporating them into your classroom. For information on taking any the Nature Neighborhood online workshops for CEUs or EE credit, visit: https://naturalsciences.org/learn/educators/online-workshops.
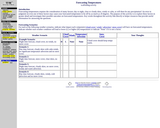
Students explore the difference between weather and climate by investigating extreme weather …
Students explore the difference between weather and climate by investigating extreme weather on Earth and its contributing factors. Students brainstorm a list of weather-related words and phrases. They will then gather information about weather by viewing images and videos and discussing with peers, and then record the information they have learned on a provided worksheet.
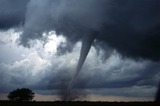
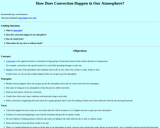
The purpose of this online tutorial activity is to introduce some indicators …
The purpose of this online tutorial activity is to introduce some indicators that useful for predicting when and where precipitation is going to occur. Key words throughout this activity link directly to helper resources that provide useful information for answering the questions.
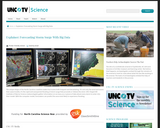
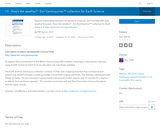
This multimedia resource, part of the NC Science Now series, describes a …
This multimedia resource, part of the NC Science Now series, describes a new computer model of storm surge, developed by the UNC Chapel Hill Institute of Marine Science, that leads to a new way for NOAA to issue hurricane warnings starting this year. The model also allows forecasters to better predict the area most likely to experience flooding due to storm surge following hurricane winds. Components of this resource include a video, related text articles, and an interview with David Glenn, a meteorologist for the National Weather Service in Morehead City, NC. Links to these components are provided on the page under the heading "UNC-TV Media."
The purpose of this online tutorial activity is to explore these factors …
The purpose of this online tutorial activity is to explore these factors in greater detail and investigate their possible outcomes on forecasted temperatures. Key words throughout this activity link directly to helper resources that provide useful information for answering the questions.
Students will use GLOBE visualizations to display student data on mpas and …
Students will use GLOBE visualizations to display student data on mpas and to learn about seasonal changes in regional and global temperature patterns.
In this activity, students build an anemometer and then measure wind speed …
In this activity, students build an anemometer and then measure wind speed in areas of differing topography to study how natural and man-made topography affect wind speed.
Explore relationships between temperature, pressure, and humidity with daily weather forecasts. GeoInquiries …
Explore relationships between temperature, pressure, and humidity with daily weather forecasts.
GeoInquiries are designed to be fast and easy-to-use instructional resources that incorporate advanced web mapping technology. Each 15-minute activity in a collection is intended to be presented by the instructor from a single computer/projector classroom arrangement. No installation, fees, or logins are necessary to use these materials and software.
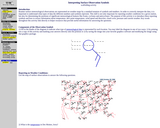
The purpose of this online tutorial activity is to introduce these reporting …
The purpose of this online tutorial activity is to introduce these reporting symbols and how to extract information about temperature, dew point temperature, wind speed and direction, cloud cover, pressure and current weather. Key words throughout this activity link directly to helper resources that provide useful information for answering the questions.
In this lesson, students will download two historic datasets from NCDC: Global …
In this lesson, students will download two historic datasets from NCDC: Global Summary of the Day (GSOD) daily temperature data and Historic Global Historical Climatology Network (GHCN) monthly temperature data. After importing the data into Microsoft Excel, they will graph and compare daily to monthly temperatures for Barrow, Alaska, and repeat this process for Key West, Florida. They will then compare these patterns to other temperature trends in the United States and globally.
No restrictions on your remixing, redistributing, or making derivative works. Give credit to the author, as required.
Your remixing, redistributing, or making derivatives works comes with some restrictions, including how it is shared.
Your redistributing comes with some restrictions. Do not remix or make derivative works.
Most restrictive license type. Prohibits most uses, sharing, and any changes.
Copyrighted materials, available under Fair Use and the TEACH Act for US-based educators, or other custom arrangements. Go to the resource provider to see their individual restrictions.