This lab demonstrates Ohm's law as students set up simple circuits each …
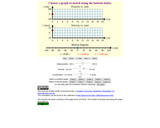
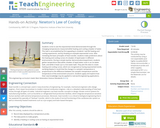
This lab demonstrates Ohm's law as students set up simple circuits each composed of a battery, lamp and resistor. Students calculate the current flowing through the circuits they create by solving linear equations. After solving for the current, I, for each set resistance value, students plot the three points on a Cartesian plane and note the line that is formed. They also see the direct correlation between the amount of current flowing through the lamp and its brightness.
The story of "“Humpty Dumpty" has been around for a very long …
The story of "“Humpty Dumpty" has been around for a very long time. Long ago one idea that came to the light was that of a large cannon that fell and could not be put back together again. It is fun to compare fiction and to make predictions about what might have really happened. Most students will in their backgrounds relate to this captivating story.
The story of “Where The Wild Things Are” by Maurice Sendak has …
The story of “Where The Wild Things Are” by Maurice Sendak has been around for a while. It was Supposed to be “Where the Wild Horses Are”, but Mr. Sendak as an author made changes to his story. This is a good way to show students the process of an author in making decisions when creating a story.
The story of Shrek and the movies have really made an impact. …
The story of Shrek and the movies have really made an impact. Many children see a Shrek figure and want it. They do not see it as ugly which is what an Ogre is supposed to be. So, the real inspiration for Shrek Maurice Tillet lived during the early 1900’s. He was called the “French Angel” and he was an amazing person. It is fun to compare fiction to fact as well as opinions on what is ugly and what is pretty.
In this lesson, students complete several activities that involve coordinates and graph …
In this lesson, students complete several activities that involve coordinates and graph paper given the following invitation to learn: "Suppose you are having a birthday party and a friend you have invited has asked you for directions from the school to your house. You tell them it is five blocks away. Is this enough information for them to find your house?"
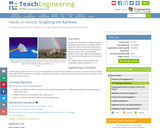
Students will select a question that they are interested in finding information …
Students will select a question that they are interested in finding information about such as, "What is your favorite food?" Then students choose three items that their classmates will have to choose from; for example, 1)pizza, 2) hot dog, 3) nachos. With some instruction on data collection, groups of students survey others on their question using tally marks. They will complete a line graph of the collected data.
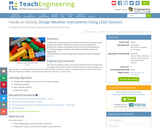
Student teams design and create LEGO® structures to house and protect temperature …
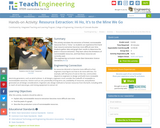
Student teams design and create LEGO® structures to house and protect temperature sensors. They leave their structures in undisturbed locations for a week, and regularly check and chart the temperatures. This activity engages students in the design and analysis aspects of engineering.
Students are introduced to different ways of displaying visual spectra, including colored …
Students are introduced to different ways of displaying visual spectra, including colored "barcode" spectra, like those produced by a diffraction grating, and line plots displaying intensity versus color, or wavelength. Students learn that a diffraction grating acts like a prism, bending light into its component colors.
This activity simulates the extraction of limited, nonrenewable resources from a "mine," …
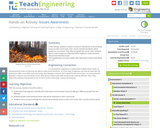
This activity simulates the extraction of limited, nonrenewable resources from a "mine," so students can experience first-hand how resource extraction becomes more difficult over time. Students gather data and graph their results to determine the peak in resource extraction. They learn about the limitations of nonrenewable resources, and how these resources are currently used.
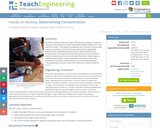
In this activity, students will conduct a survey to identify the environmental …
In this activity, students will conduct a survey to identify the environmental issues (in their community, their country and the world) for which people are concerned. They will tally and graph the results. Also, students will discuss how surveys are important when engineers make decisions about environmental issues.
An interactive applet that allows the user to graphically explore the properties …
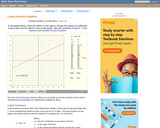
An interactive applet that allows the user to graphically explore the properties of a linear functions. Specifically, it is designed to foster an intuitive understanding of the effects of changing the two coefficients in the function y=ax+b. The applet shows a large graph of a quadratic (ax + b) and has two slider controls, one each for the coefficients a and b. As the sliders are moved, the graph is redrawn in real time illustrating the effects of these variations. Applet can be enlarged to full screen size for use with a classroom projector. This resource is a component of the Math Open Reference Interactive Geometry textbook project at http://www.mathopenref.com.
Students come to see the exponential trend demonstrated through the changing temperatures …
Students come to see the exponential trend demonstrated through the changing temperatures measured while heating and cooling a beaker of water. This task is accomplished by first appealing to students' real-life heating and cooling experiences, and by showing an example exponential curve. After reviewing the basic principles of heat transfer, students make predictions about the heating and cooling curves of a beaker of tepid water in different environments. During a simple teacher demonstration/experiment, students gather temperature data while a beaker of tepid water cools in an ice water bath, and while it heats up in a hot water bath. They plot the data to create heating and cooling curves, which are recognized as having exponential trends, verifying Newton's result that the change in a sample's temperature is proportional to the difference between the sample's temperature and the temperature of the environment around it. Students apply and explore how their new knowledge may be applied to real-world engineering applications.
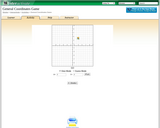
The purpose of this lesson is to teach students about the three …
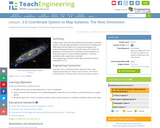
The purpose of this lesson is to teach students about the three dimensional Cartesian coordinate system. It is important for structural engineers to be confident graphing in 3D in order to be able to describe locations in space to fellow engineers.
* This unit is an adaptation of the Everyday Mathematics (EM) Kindergarten …
* This unit is an adaptation of the Everyday Mathematics (EM) Kindergarten Curriculum, 4th Edition, published by McGraw Hill Education. The source material is copyrighted and all rights are reserved. With this in mind, only the adaptations will be explored in this document. To access the Everyday Mathematics curriculum and some online components, your school or district must purchase them from McGraw Hill.
The Everyday Mathematics curriculum does not teach concepts in the historical unit-by-unit format. Rather, key concepts are introduced and revisited in several units throughout the year. The focus on returning to concept strands is referred to as "spiralling." The spiral strand targeted in this unit is focussed on data collection and representation. Students will learn how to represent data on (and read data from) charts and graphs.
Students are introduced to several types of common medical sensor devices, such …
Students are introduced to several types of common medical sensor devices, such as ear and forehead thermometers, glucometers and wrist blood pressure monitors; they use the latter to measure their blood pressure and pulse rates. Students also measure their heights and weights in order to calculate their BMIs (body mass index). Then they use the collected data to create and analyze scatterplots of the different variables to determine if any relationships exist between the measured variables. Discussions about the trends observed and possible health concerns conclude the activity.
This resource is part of Tools4NCTeachers. This packet contains exit tickets for …
This resource is part of Tools4NCTeachers.
This packet contains exit tickets for the standard MD.4. Exit tickets are written responses to questions posed at the end of a lesson. They are brief assessments which allow the teacher to determine student understanding of the concepts and skills taught that day. At the beginning of the year, or a blank copy of the exit ticket may need to be displayed on the board and read aloud to students.
This resource is from Tools4NCTeachers. In this lesson, students will create a survey …
This resource is from Tools4NCTeachers. In this lesson, students will create a survey question, collect data, create a bar graph, write and answer questions about the collected data. This lesson may take two days to complete. Printable, samples of student work, sample anchor charts, and extension ideas are included within this lesson.
No restrictions on your remixing, redistributing, or making derivative works. Give credit to the author, as required.
Your remixing, redistributing, or making derivatives works comes with some restrictions, including how it is shared.
Your redistributing comes with some restrictions. Do not remix or make derivative works.
Most restrictive license type. Prohibits most uses, sharing, and any changes.
Copyrighted materials, available under Fair Use and the TEACH Act for US-based educators, or other custom arrangements. Go to the resource provider to see their individual restrictions.