This resource accompanies our Rethink 6th Grade Math course. It includes ideas …
This resource accompanies our Rethink 6th Grade Math course. It includes ideas for use, ways to support exceptional children, ways to extend learning, digital resources and tools, tips for supporting English Language Learners and students with visual and hearing impairments. There are also ideas for offline learning.
This lesson from Illuminations illustrates how weather data can be collected and …
This lesson from Illuminations illustrates how weather data can be collected and examined. In the first part, Collecting and Examining Weather Data, students organize and then examine data that has been collected over a period of time in a spreadsheet. In the second part, Representing and Interpreting Data, students use the graphing functions of a spreadsheet to help them interpret data.
Students make up a set of eight numbers that simultaneously satisfy given …
Students make up a set of eight numbers that simultaneously satisfy given constraints. The mathematics task is intended to be a problem or question that encourages the use of mathematical practices. The dialogue is meant to show how students might engage in the mathematical practices as they work on the task.
In this unit plan, students will be able to answer the following …
In this unit plan, students will be able to answer the following essential questions: 1. How much time should the average fifth-grade student spend on homework to make good grades? 2. Which types of graphs are appropriate for the different kinds of data? 3. How are the different statistical measures (range and measures of central tendency) used to interpret the data?
Students collect data on the number of raisins in 17 boxes of …
Students collect data on the number of raisins in 17 boxes of raisins. They will use the data to analyze data and interprete results, answer a series of questions about variation, and construct data in plots.
In this lesson, students define the center of a data distribution by …
In this lesson, students define the center of a data distribution by a "fair share" value called the mean. Students connect the "fair share" concept with a mathematical formula for finding the mean.
Students will research the ten day weather forecast. They will document the …
Students will research the ten day weather forecast. They will document the high's for ten days as well as the low's for ten days. Once students document this information, they will find the mean, median, mode, and range of the data collected.
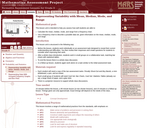
In this module, students move from simply representing data into analysis of …
In this module, students move from simply representing data into analysis of data. Students begin to think and reason statistically, first by recognizing a statistical question as one that can be answered by collecting data. Students learn that the data collected to answer a statistical question has a distribution that is often summarized in terms of center,
In this graph project students will create a statistical question, gather, analyze, …
In this graph project students will create a statistical question, gather, analyze, and graph data either by hand or using technology. The project includes a rubric to help students understand how the project will be assessed more clearly.
Students will relate music and melodies in a song to mean, median …
Students will relate music and melodies in a song to mean, median and mode. They also discuss what measure of center are appropriate when it relates to music CD sales.
This lesson unit is intended to help you assess how well students …
This lesson unit is intended to help you assess how well students are able to: Calculate the mean, median, mode, and range from a frequency chart; and to use a frequency chart to describe a possible data set, given information on the mean, median, mode, and range.
In this lesson, students interpret the mean of a set of data …
In this lesson, students interpret the mean of a set of data set as a "typical" value, as well as compare and contrast two small data sets that have the same mean but different amounts of variability.
This course was created by the Rethink Education Content Development Team in …
This course was created by the Rethink Education Content Development Team in partnership with the North Carolina Virtual Public Schools. This course is aligned to the NC Standards for 6th Grade Math.
No restrictions on your remixing, redistributing, or making derivative works. Give credit to the author, as required.
Your remixing, redistributing, or making derivatives works comes with some restrictions, including how it is shared.
Your redistributing comes with some restrictions. Do not remix or make derivative works.
Most restrictive license type. Prohibits most uses, sharing, and any changes.
Copyrighted materials, available under Fair Use and the TEACH Act for US-based educators, or other custom arrangements. Go to the resource provider to see their individual restrictions.