In this activity, students determine their own eyesight and calculate what a …
In this activity, students determine their own eyesight and calculate what a good average eyesight value for the class would be. Students learn about technologies to enhance eyesight and how engineers play an important role in the development of these technologies.
Students will create videos that convince the rest of the 6th graders …
Students will create videos that convince the rest of the 6th graders that math is allaround them by doing activities that they love. Students will gather data, create dotplots, histograms and box-and-whisker plots to display data.
This resource accompanies our Rethink 6th Grade Math course. It includes ideas …
This resource accompanies our Rethink 6th Grade Math course. It includes ideas for use, ways to support exceptional children, ways to extend learning, digital resources and tools, tips for supporting English Language Learners and students with visual and hearing impairments. There are also ideas for offline learning.
Sixth grade students became statisticians as they collaborated with small groups of …
Sixth grade students became statisticians as they collaborated with small groups of peers to spill the “t” on their fellow peers. The “t” is another term used for “the truth.” Students developed and implemented their own statistical survey questions to get the “t.” They later graphed and analyzed the data in many different formats.
In this part of the unit, students are exploring how global temperatures …
In this part of the unit, students are exploring how global temperatures have changed over the past hundred years. Students will examine tables and graphs about global temperatures and carbon dioxide levels, human consumption of food, and human consumption of natural resources. They will find patterns in the graphs. Based on this data, students will construct an argument about how human activities (increase in population and consumption of natural resources) cause global temperatures to increase.
Students are introduced to measuring and identifying sources of air pollution, as …
Students are introduced to measuring and identifying sources of air pollution, as well as how environmental engineers try to control and limit the amount of air pollution. In Part 1, students are introduced to nitrogen dioxide as an air pollutant and how it is quantified. Major sources are identified, using EPA bar graphs. Students identify major cities and determine their latitudes and longitudes. They estimate NO2 values from color maps showing monthly NO2 averages from two sources: a NASA satellite and the WSU forecast model AIRPACT. In Part 2, students continue to estimate NO2 values from color maps and use Excel to calculate differences and ratios to determine the model's performance. They gain experience working with very large numbers written in scientific notation, as well as spreadsheet application capabilities.
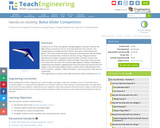
The purpose of this activity is to bring together the students' knowledge …
The purpose of this activity is to bring together the students' knowledge of engineering and airplanes and the creation of a glider model to determine how each modification affects the flight. The students will use a design procedure whereby one variable is changed and all the others are kept constant.
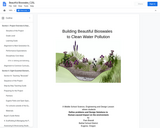
In this 1-2 week engineering design lesson, students will design and build …
In this 1-2 week engineering design lesson, students will design and build water filters out of natural materials to simulate a filter system (bioswales) that cleans storm-water runoff before it soaks into the ground or enters a city’s storm-drain system. Their ultimate goal is to determine the combination and sequence of materials that best clean polluted water. Using materials easily found in pet stores and garden centers, students use the scientific method, students design to test and retest their designs and record, display and analyze their results.
Students will build and launch Magnus Effect gliders and measure the distance …
Students will build and launch Magnus Effect gliders and measure the distance they fly. They will analyze the data to judge which material gives the glider the most distance. Then they may do the same process for other variables.
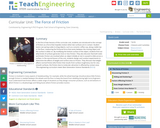
n this activity, students learn some of the pitfalls of doing surveys. …
n this activity, students learn some of the pitfalls of doing surveys. They also learn to examine the shape of data, including data clusters, the range and typical values. This Cyberchase activity is motivated by a video segment in which the CyberSquad searches for Hacker's castle based on a survey of where town residents have last seen him.
In this lesson, students are given a data set to describe the …
In this lesson, students are given a data set to describe the data collected, including the number of responses, mean or median, and the MAD or the interquartile range (IQR).
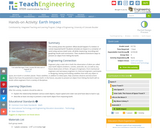
This activity poses the question: What would happen if a meteor or …
This activity poses the question: What would happen if a meteor or comet impacted Earth? Students simulate an impact in a container of sand using various-sized rocks, all while measuring, recording and graphing results and conclusions. Then students brainstorm ways to prevent an object from hitting the Earth.
In the first of two lessons of this curricular unit, students are …
In the first of two lessons of this curricular unit, students are introduced to the concept of friction as a force that impedes motion when two surfaces are in contact. Student teams use spring scales to drag objects, such as a ceramic coffee cup, along a table top or the floor, measuring the frictional force that exists between the moving object and the surface it slides on. By modifying the bottom surface of the object, students find out what kinds of surfaces generate more or less friction. They also discover that both static and kinetic friction are involved when an object initially at rest is caused to slide across a surface. In the second lesson of the unit, students design and conduct experiments to determine the effects of weight and surface area on friction. They discover that weight affects normal friction (the friction that results from surface roughness), but for very smooth surfaces, the friction due to molecular attraction is affected by contact area.
In this lesson, students are given a frequency histogram to describe the …
In this lesson, students are given a frequency histogram to describe the data collected, including the number of responses, an estimate of the mean or median, and an estimate of the interquartile range (IQR) or the mean absolute deviation (MAD).
Students learn how the greenhouse effect is related to global warming and …
Students learn how the greenhouse effect is related to global warming and how global warming impacts our planet, including global climate change. Extreme weather events, rising sea levels, and how we react to these changes are the main points of focus of this lesson.
In this module, students move from simply representing data into analysis of …
In this module, students move from simply representing data into analysis of data. Students begin to think and reason statistically, first by recognizing a statistical question as one that can be answered by collecting data. Students learn that the data collected to answer a statistical question has a distribution that is often summarized in terms of center,
Students are presented with a guide to rain garden construction in an …
Students are presented with a guide to rain garden construction in an activity that culminates the unit and pulls together what they have learned and prepared in materials during the three previous associated activities. They learn about the four vertical zones that make up a typical rain garden with the purpose to cultivate natural infiltration of stormwater. Student groups create personal rain gardens planted with native species that can be installed on the school campus, within the surrounding community, or at students' homes to provide a green infrastructure and low-impact development technology solution for areas with poor drainage that often flood during storm events.
No restrictions on your remixing, redistributing, or making derivative works. Give credit to the author, as required.
Your remixing, redistributing, or making derivatives works comes with some restrictions, including how it is shared.
Your redistributing comes with some restrictions. Do not remix or make derivative works.
Most restrictive license type. Prohibits most uses, sharing, and any changes.
Copyrighted materials, available under Fair Use and the TEACH Act for US-based educators, or other custom arrangements. Go to the resource provider to see their individual restrictions.