This 7th grade Math parent guide explains the content in straightforward terms so they …
This 7th grade Math parent guide explains the content in straightforward terms so they can support their children’s learning at home and will encourage caretaker engagement with lessons.
Our Teacher Guides are meant to support the use of our online …
Our Teacher Guides are meant to support the use of our online course and unit content. Please use these to accompany the use of our content and for ideas to support struggling learners, those needing extension and for additional resources.
This is a hands-on project that uses George Orwell's novel, Animal Farm, …
This is a hands-on project that uses George Orwell's novel, Animal Farm, as the touchstone text. Students work in groups to construct a functioning windmill that can generate electricity. Each student has a role based on the characters in the book. There are also segments of the project that focus on extracting key information from the text.
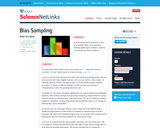
Students learn about sampling bias by working in three separate groups to …
Students learn about sampling bias by working in three separate groups to survey students, parents, and teachers about the amount of homework students ought to have. They report and compare the responses from each of the three groups to see how the results differ. Activity sheets, discussion questions, ideas for assessment and extensions, and Internet links are included.
In this lesson, students differentiate between a population and a sample. Students …
In this lesson, students differentiate between a population and a sample. Students differentiate between a population characteristic and a sample statistic. Students investigate statistical questions that involve generalizing from a sample to a larger population.
The purpose of this lesson is for students to make a hypothesis, …
The purpose of this lesson is for students to make a hypothesis, and then doing an experiment to test each students hypothesis. Students will collect and record their data, use graphical methods to describe their data, and finally analyze and interpret their results in the context of the activity.
This task introduces the fundamental statistical ideas of using data summaries (statistics) …
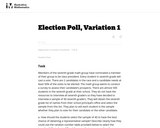
This task introduces the fundamental statistical ideas of using data summaries (statistics) from random samples to draw inferences (reasoned conclusions) about population characteristics (parameters). In the task built around an election poll scenario, the population is the entire seventh grade class, the unknown characteristic (parameter) of interest is the proportion of the class members voting for a specific candidate, and the sample summary (statistic) is the observed proportion of voters favoring the candidate in a random sample of class members.
This task introduces the fundamental statistical ideas of using data summaries (statistics) …
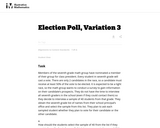
This task introduces the fundamental statistical ideas of using data summaries (statistics) from random samples to draw inferences (reasoned conclusions) about population characteristics (parameters). In the task built around an election poll scenario, the population is the entire seventh grade class, the unknown characteristic (parameter) of interest is the proportion of the class members voting for a specific candidate, and the sample summary (statistic) is the observed proportion of voters favoring the candidate in a random sample of class members.
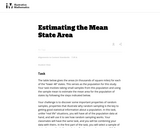
The task is designed to show that random samples produce distributions of …
The task is designed to show that random samples produce distributions of sample means that center at the population mean, and that the variation in the sample means will decrease noticeably as the sample size increases. Random sampling (like mixing names in a hat and drawing out a sample) is not a new idea to most students, although the terminology is likely to be new.
This resource allows students to write an appropriate survey question, describe a …
This resource allows students to write an appropriate survey question, describe a reasonable way to select a random sample of students, create a table or graph appropriate for the categorical data collected, and use data summarized in the table or graph to draw a conclusion.
This course was created by the Rethink Education Content Development Team in …
This course was created by the Rethink Education Content Development Team in partnership with the North Carolina Virtual Public Schools. This course is aligned to the NC Standards for 7th Grade Math.
This course was created by the Rethink Education Content Development Team in …
This course was created by the Rethink Education Content Development Team in partnership with the North Carolina Virtual Public Schools. This course is aligned to the NC Standards for 7th Grade Math.
This course was created by the Rethink Education Content Development Team in …
This course was created by the Rethink Education Content Development Team in partnership with the North Carolina Virtual Public Schools. This course is aligned to the NC Standards for 7th Grade Math.
In this lesson, students understand that how a sample is selected is …
In this lesson, students understand that how a sample is selected is important if the goal is to generalize from the sample to a larger population. Students understand that random selection from a population tends to produce samples that are representative of the population.
This investigation focuses on guiding students as they collect and interpret data …
This investigation focuses on guiding students as they collect and interpret data from a spinner experiment with outcomes that are equally likely. Students will have the opportunity to organize the collected data in tables and graphs and will draw conclusions and make predictions based on the data collected.
No restrictions on your remixing, redistributing, or making derivative works. Give credit to the author, as required.
Your remixing, redistributing, or making derivatives works comes with some restrictions, including how it is shared.
Your redistributing comes with some restrictions. Do not remix or make derivative works.
Most restrictive license type. Prohibits most uses, sharing, and any changes.
Copyrighted materials, available under Fair Use and the TEACH Act for US-based educators, or other custom arrangements. Go to the resource provider to see their individual restrictions.