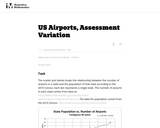
This is a task from the Illustrative Mathematics website that is one …
This is a task from the Illustrative Mathematics website that is one part of a complete illustration of the standard to which it is aligned. Each task has at least one solution and some commentary that addresses important asects of the task and its potential use. Here are the first few lines of the commentary for this task: The scatter plot below shows the relationship between the number of airports in a state and the population of that state according to the 2010 Census. ...
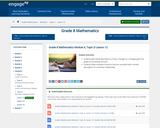
This 8th grade Math parent guide explains the content in straightforward terms so they …
This 8th grade Math parent guide explains the content in straightforward terms so they can support their children’s learning at home and will encourage caretaker engagement with lessons.
Our Teacher Guides are meant to support the use of our online …
Our Teacher Guides are meant to support the use of our online course and unit content. Please use these to accompany the use of our content and for ideas to support struggling learners, those needing extension and for additional resources.
In this math activity, students conduct a strength test using modeling clay, …
In this math activity, students conduct a strength test using modeling clay, creating their own stress vs. strain graphs, which they compare to typical steel and concrete graphs. They learn the difference between brittle and ductile materials and how understanding the strength of materials, especially steel and concrete, is important for engineers who design bridges and structures.
In this lesson students learn to model a real-life situation by collecting …
In this lesson students learn to model a real-life situation by collecting data from a few trials, graphing the data, and then drawing a line of best fit that can be used to make predictions.
Students are presented with a graph of atmospheric becomes CO² values from …
Students are presented with a graph of atmospheric becomes CO² values from Mauna Loa Observatory, and are asked to explore the data by creating a trend line using the linear equation, and then use the equation to predict future becomes CO² levels. Students are asked to describe qualitatively what they have determined mathematically, and suggest reasons for the patterns they observe in the data. A clue to the reason for the data patterning can be deduced by students by following up this activity with the resource, Seasonal Vegetation Changes. The data graph and a student worksheet is included with this activity. This is an activity from Space Update, a collection of resources and activities provided to teach about Earth and space. Summary background information, data and images supporting the activity are available on the Earth Update data site.
In this lesson, students give verbal descriptions of how y changes as …
In this lesson, students give verbal descriptions of how y changes as x changes given the graph of a nonlinear function. Students draw nonlinear functions that are consistent with a verbal description of a nonlinear relationship.
Students learn about weight and drag forces by making paper helicopters and …
Students learn about weight and drag forces by making paper helicopters and measuring how adding more weight affects the time it takes for the helicopters to fall to the ground.
In past times, ocean navigators tossed a piece of wood over the …
In past times, ocean navigators tossed a piece of wood over the side of their ships and noted how long until the ship passed the wood. They used this time measurement and the length of the ship to calculate their speed and estimate how far they had traveled. In this activity, students act the part of a GPS signal traveling to the receiver to learn how travel time is converted to distance.
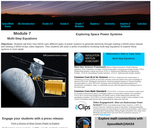
This is a set of three, one-page problems about mass and power …
This is a set of three, one-page problems about mass and power of spacecraft. Learners will use multi-step equations to solve several diverse problems. Options are presented so that students may learn about different types of power systems to generate electricity through a NASA press release or by viewing a NASA eClips video [7 min.]. This activity is part of the Space Math multi-media modules that integrate NASA press releases, NASA archival video, and mathematics problems targeted at specific math standards commonly encountered in middle school.
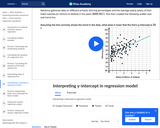
Students will learn how to write an equation of a linear function …
Students will learn how to write an equation of a linear function when given a set of data. They will interpret the meaning of the slope and y-intercept and then use the equation to find other values of x and y.
This course was created by the Rethink Education Content Development Team in …
This course was created by the Rethink Education Content Development Team in partnership with the North Carolina Virtual Public Schools. This course is aligned to the NC Standards for 8th Grade Math.
This course was created by the Rethink Education Content Development Team in …
This course was created by the Rethink Education Content Development Team in partnership with the North Carolina Virtual Public Schools. This course is aligned to the NC Standards for 8th Grade Math.
This course was created by the Rethink Education Content Development Team in …
This course was created by the Rethink Education Content Development Team in partnership with the North Carolina Virtual Public Schools. This course is aligned to the NC Standards for 8th Grade Math.
Students are introduced to several types of common medical sensor devices, such …
Students are introduced to several types of common medical sensor devices, such as ear and forehead thermometers, glucometers and wrist blood pressure monitors; they use the latter to measure their blood pressure and pulse rates. Students also measure their heights and weights in order to calculate their BMIs (body mass index). Then they use the collected data to create and analyze scatterplots of the different variables to determine if any relationships exist between the measured variables. Discussions about the trends observed and possible health concerns conclude the activity.
In this lesson, students recognize and justify that a linear model can …
In this lesson, students recognize and justify that a linear model can be used to fit data. Students interpret the slope of a linear model to answer questions or to solve a problem.
In this lesson, students identify situations where it is reasonable to use …
In this lesson, students identify situations where it is reasonable to use a linear function to model the relationship between two numerical variables. Students interpret slope and the initial value in a data context.
No restrictions on your remixing, redistributing, or making derivative works. Give credit to the author, as required.
Your remixing, redistributing, or making derivatives works comes with some restrictions, including how it is shared.
Your redistributing comes with some restrictions. Do not remix or make derivative works.
Most restrictive license type. Prohibits most uses, sharing, and any changes.
Copyrighted materials, available under Fair Use and the TEACH Act for US-based educators, or other custom arrangements. Go to the resource provider to see their individual restrictions.