This is a PBL lesson where students explore the Physics behind motion …
This is a PBL lesson where students explore the Physics behind motion of objects. Students will collaborate and come up with a video showing the difference between distance and displacement, speed and velocity and acceleration. In this remix, students are given options and choices that relate to their interest.
This is a PBL lesson where students explore the Physics behind motion …
This is a PBL lesson where students explore the Physics behind motion of objects. Students will collaborate and come up with a video showing the difference between distance and displacement, speed and velocity and acceleration.
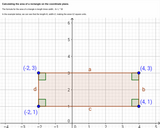
Images of rectangle on coordinate plane, one with easily identifiable area, other …
Images of rectangle on coordinate plane, one with easily identifiable area, other image with same rectangle rotated. Distance formula shown to calculate same area.
This lesson is Day 3 in a series of 5 lessons around …
This lesson is Day 3 in a series of 5 lessons around U.S customary measurement.
This video lesson explores the use of appropriate units for measuring length. Additionally, students will be asked to solve single-step problems involving lengths of distances. No materials are needed for this lesson.
Students determine how far a brother and sister travel before they catch …
Students determine how far a brother and sister travel before they catch up with one another. The mathematics task is intended to be a problem or question that encourages the use of mathematical practices. The dialogue is meant to show how students might engage in the mathematical practices as they work on the task.
This is an introductory activity that introduces the concept of work and …
This is an introductory activity that introduces the concept of work and helps students understand the difference between work and energy in terms of pulling and lifting masses.
In this activity students practice measuring techniques by measuring different objects and …
In this activity students practice measuring techniques by measuring different objects and distances around the classroom. They practice using different scales of measurement in metric units and estimation.
In this lab activity, students investigate the concept of frame of reference …
In this lab activity, students investigate the concept of frame of reference by observing, describing and drawing the same walking motion from different positions. Additionally, they determine the effect of frame of reference on the walking time. Students analyze their data and observations and develop a working definition of the concept of frame of reference. A description of the lab report format is provided.
Rate Type of Unit: Concept Prior Knowledge Students should be able to: …
Rate
Type of Unit: Concept
Prior Knowledge
Students should be able to:
Solve problems involving all four operations with rational numbers. Understand quantity as a number used with a unit of measurement. Solve problems involving quantities such as distances, intervals of time, liquid volumes, masses of objects, and money, and with the units of measurement for these quantities. Understand that a ratio is a comparison of two quantities. Write ratios for problem situations. Make and interpret tables, graphs, and diagrams. Write and solve equations to represent problem situations.
Lesson Flow
In this unit, students will explore the concept of rate in a variety of contexts: beats per minute, unit prices, fuel efficiency of a car, population density, speed, and conversion factors. Students will write and refine their own definition for rate and then use it to recognize rates in different situations. Students will learn that every rate is paired with an inverse rate that is a measure of the same relationship. Students will figure out the logic of how units are used with rates. Then students will represent quantitative relationships involving rates, using tables, graphs, double number lines, and formulas, and they will see how to create one such representation when given another.
Gallery OverviewAllow students who have a clear understanding of the content thus …
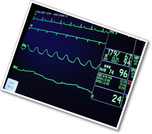
Gallery OverviewAllow students who have a clear understanding of the content thus far in the unit to work on Gallery problems of their choosing. You can then use this time to provide additional help to students who need review of the unit's concepts or to assist students who may have fallen behind on work.Gallery DescriptionsCreate Your Own RateStudents create their own rate problems, given three quantities that must all be used in the problems or the answers.Paper Clip ChallengeStudents think about rate in the context of setting a record for making a paperclip chain.The Speed of Light Students must determine the speed of light so they can figure out how long it will take a light beam from Earth to reach the Moon (assuming it would make it there). They conduct research and perform calculations.Tire WeightStudents connect area and a rate they may not be familiar with, tire pressure, to indirectly weigh a car. They find and add areas and do a simple rate calculation. Please note this problem requires adult supervision for the process of measuring the car tires. If no adult supervision is available, you can provide students with measurements to work with inside the classroom. Do not allow students to work with a car without permission from the owner and adult supervision.Planting Wildflowers Students apply area and length concepts (square miles, acres, and feet) to rectangles, choose and carry out appropriate area conversions, and show each step of their solutions. While specific solution paths will vary, all students who show good conceptualization will make at least one area conversion and show understanding about area even when dimensions and units change. This task allows several different correct solution paths.Train Track Students use information about laying railroad ties for the Union Pacific Railroad. These rates are different from those used elsewhere in the unit, asking how many rails per gang of workers, how long it takes to lay one mile of track, and how many spikes are needed for a mile of track.HeartbeatsStudents will investigate and compare the heartbeats of different animals and their own heartbeat.FoghornStudents use the relationships among seconds, minutes, and hours to find equivalent rates. Each step requires students to express an equivalent rate in terms of these different units of time. In any strong response, students use conversion factors and the given rate to find equivalent rates.
In this lesson, students first watch three racers racing against each other. …
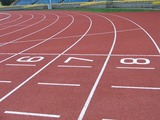
In this lesson, students first watch three racers racing against each other. The race is shown on a track and represented on a graph. Students then change the speed, distance, and time to create a race with different results. They graph the new race and compare their graph to the original race graph.Key ConceptsA rate situation can be represented by a graph. Each point on a graph represents a pair of values. In today's situation, each point represents an amount of time and the distance a racer traveled in that amount of time. Time is usually plotted on the horizontal axis. The farther right a point is from the origin, the more time has passed from the start. Distance is usually plotted on the vertical axis. The higher up a point is from the origin, the farther the snail has traveled from the start. A graph of a constant speed is a straight line. Steeper lines show faster speeds.Goals and Learning ObjectivesUnderstand that a graph can be a visual representation of an actual rate situation.Plot pairs of related values on a graph.Use graphs to develop an understanding of rates.
In this lesson, students watch a video of a runner and express …
In this lesson, students watch a video of a runner and express his speed as a rate in meters per second. Students then use the rate to determine how long it takes the runner to go any distance.Key ConceptsSpeed is a rate that is expressed as distance traveled per unit of time. Miles per hour, laps per minute, and meters per second are all examples of units for speed. The measures of speed, distance, and time are all related. The relationship can be expressed in three ways: d = rt, r = dt, t = dr.Goals and Learning ObjectivesExplore speed as a rate that measures the relationship between two aspects of a situation: distance and time.In comparing distance, speed, and time, understand how to use any two of these measures to find the third measure.
Students use their knowledge of rates to solve problems.Key ConceptsGiven any two …
Students use their knowledge of rates to solve problems.Key ConceptsGiven any two values in a rate situation, you can find the third value.These three equations are equivalent, and they all describe rate relationships:y = rx, r = yx, x = yrAt the beginning of this lesson (or for homework), students will revise their work on the pre-assessment Self Check. Their revised work will provide data that you and your students can use to reassess students' understanding of rate. You can use this information to clear up any remaining misconceptions and to help students integrate their learning from the past several days into a deeper and more coherent whole.The work students do in this lesson and in revising their pre-assessments will help you and your students decide how to help them during the Gallery. In this lesson, students will reveal the depth and clarity of their understanding of rate.Students whose understanding of rate is still delicate should get extra help during the Gallery.Students who feel that they have a robust understanding of rate may choose from any of the problem-solving or deeper mathematics problems in the Gallery.Goals and Learning ObjectivesUncover any partial understandings and misconceptions about rate.Develop a more robust understanding of rate.Identify which Gallery problems to work on.
Four full-year digital course, built from the ground up and fully-aligned to …
Four full-year digital course, built from the ground up and fully-aligned to the Common Core State Standards, for 7th grade Mathematics. Created using research-based approaches to teaching and learning, the Open Access Common Core Course for Mathematics is designed with student-centered learning in mind, including activities for students to develop valuable 21st century skills and academic mindset.
Proportional Relationships Type of Unit: Concept Prior Knowledge Students should be able …
Proportional Relationships
Type of Unit: Concept
Prior Knowledge
Students should be able to:
Understand what a rate and ratio are. Make a ratio table. Make a graph using values from a ratio table.
Lesson Flow
Students start the unit by predicting what will happen in certain situations. They intuitively discover they can predict the situations that are proportional and might have a hard time predicting the ones that are not. In Lessons 2–4, students use the same three situations to explore proportional relationships. Two of the relationships are proportional and one is not. They look at these situations in tables, equations, and graphs. After Lesson 4, students realize a proportional relationship is represented on a graph as a straight line that passes through the origin. In Lesson 5, they look at straight lines that do not represent a proportional relationship. Lesson 6 focuses on the idea of how a proportion that they solved in sixth grade relates to a proportional relationship. They follow that by looking at rates expressed as fractions, finding the unit rate (the constant of proportionality), and then using the constant of proportionality to solve a problem. In Lesson 8, students fine-tune their definition of proportional relationship by looking at situations and determining if they represent proportional relationships and justifying their reasoning. They then apply what they have learned to a situation about flags and stars and extend that thinking to comparing two prices—examining the equations and the graphs. The Putting It Together lesson has them solve two problems and then critique other student work.
Gallery 1 provides students with additional proportional relationship problems.
The second part of the unit works with percents. First, percents are tied to proportional relationships, and then students examine percent situations as formulas, graphs, and tables. They then move to a new context—salary increase—and see the similarities with sales taxes. Next, students explore percent decrease, and then they analyze inaccurate statements involving percents, explaining why the statements are incorrect. Students end this sequence of lessons with a formative assessment that focuses on percent increase and percent decrease and ties it to decimals.
Students have ample opportunities to check, deepen, and apply their understanding of proportional relationships, including percents, with the selection of problems in Gallery 2.
Students determine whether a relationship between two quantities that vary is a …
Students determine whether a relationship between two quantities that vary is a proportional relationship in three different situations: the relationship between the dimensions of the actual Empire State Building and a miniature model of the building; the relationship between the distance and time to travel to an amusement park; and the relationship between time and temperature at an amusement park.Key ConceptsWhen the ratio between two varying quantities remains constant, the relationship between the two quantities is called a proportional relationship. For a ratio A:B, the proportional relationship can be described as the collection of ratios equivalent to A:B, or cA:cB, where c is positive.Goals and Learning ObjectivesIdentify proportional relationships.Explain why a situation represents a proportional relationship or why it does not.Determine missing values in a table of quantities based on a proportional relationship.
No restrictions on your remixing, redistributing, or making derivative works. Give credit to the author, as required.
Your remixing, redistributing, or making derivatives works comes with some restrictions, including how it is shared.
Your redistributing comes with some restrictions. Do not remix or make derivative works.
Most restrictive license type. Prohibits most uses, sharing, and any changes.
Copyrighted materials, available under Fair Use and the TEACH Act for US-based educators, or other custom arrangements. Go to the resource provider to see their individual restrictions.