Students learn about the role engineers and mathematicians play in developing the …
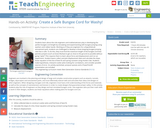
Students learn about the role engineers and mathematicians play in developing the perfect bungee cord length by simulating and experimenting with bungee jumping using washers and rubber bands. Working as if they are engineers for a (hypothetical) amusement park, students are challenged to develop a show-stopping bungee jumping ride that is safe. To do this, they must find the maximum length of the bungee cord that permits jumpers (such as brave Washy!) to get as close to the ground as possible without going "splat"! This requires them to learn about force and displacement and run an experiment. Student teams collect and plot displacement data and calculate the slope, linear equation of the line of best fit and spring constant using Hooke's law. Students make hypotheses, interpret scatter plots looking for correlations, and consider possible sources of error. An activity worksheet, pre/post quizzes and a PowerPoint® presentation are included.
Student groups are provided with a generic car base on which to …
Student groups are provided with a generic car base on which to design a device/enclosure to protect an egg on or in the car as it rolls down a ramp at increasing slopes. During this in-depth physics/science/technology activity, student teams design, build and test their creations to meet the design challenge, and are expected to perform basic mathematical calculations using collected data, including a summative cost to benefit ratio.
A Constructed Response Item provided by Smarter Balanced as preliminary examples of …
A Constructed Response Item provided by Smarter Balanced as preliminary examples of the types of items that students might encounter on the summative assessment. The item prompt students to produce a text or numerical response in order to collect evidence about their knowledge or understanding of writing a function defined by an expression in different but equivalent forms to reveal and explain different properties of a LINEAR function. MAT.HS.CR.1.00FIF.M.274
Students will participate in this discovery activity intended for them to uncover …
Students will participate in this discovery activity intended for them to uncover the role each variable plays in the graph of a line in the form y = mx + b. Students will actually demonstrate lines in slope intercept form on a life size graph. They will compare different graphs to see what effect adding negative signs and coefficients to the variables have on the graph. They will also analysis what happens to the graph when a constant is added or subtracted from the variable.
This lesson unit is intended to help teachers assess how well students …
This lesson unit is intended to help teachers assess how well students are able to interpret distanceĐtime graphs and, in particular, to help you identify students who: interpret distanceĐtime graphs as if they are pictures of situations rather than abstract representations of them; and have difficulty relating speeds to slopes of these graphs.
In this lesson students will learn about the basic soils components, importance …
In this lesson students will learn about the basic soils components, importance of soils,main ideas in land evaluation including: texture, depth, slope and erosion and career possibilities.
In this physics interactive lecture demonstration, students will observe the constancy of …
In this physics interactive lecture demonstration, students will observe the constancy of gravity in a variety of different situations. They will predict what will happen if a plastic bottle, filled with water and having a hole near the bottom, is dropped. Will the bottle fall at the same rate as the water inside the bottle?
In this two-part example from Illuminations, users can drag a slider on …
In this two-part example from Illuminations, users can drag a slider on an interactive graph to modify a rate of change (cost per minute for phone use) and learn how modifications in that rate affect the linear graph displaying accumulation (the total cost of calls). In this first part, Constant Cost per Minute, the cost per minute for phone use remains constant over time. In the second part, Changing Cost per Minute, the cost per minute for phone use changes after the first sixty minutes of calls. e-Math Investigations are selected e-examples from the electronic version of the Principles and Standards of School Mathematics (PSSM). The e-examples are part of the electronic version of the PSSM document. Given their interactive nature and focused discussion tied to the PSSM document, the e-examples are natural companions to the i-Math investigations.
This lesson unit is intended to help teahcers assess how well students …
This lesson unit is intended to help teahcers assess how well students are able to interpret speed as the slope of a linear graph and translate between the equation of a line and its graphical representation.
Four full-year digital course, built from the ground up and fully-aligned to …
Four full-year digital course, built from the ground up and fully-aligned to the Common Core State Standards, for 7th grade Mathematics. Created using research-based approaches to teaching and learning, the Open Access Common Core Course for Mathematics is designed with student-centered learning in mind, including activities for students to develop valuable 21st century skills and academic mindset.
Proportional Relationships Type of Unit: Concept Prior Knowledge Students should be able …
Proportional Relationships
Type of Unit: Concept
Prior Knowledge
Students should be able to:
Understand what a rate and ratio are. Make a ratio table. Make a graph using values from a ratio table.
Lesson Flow
Students start the unit by predicting what will happen in certain situations. They intuitively discover they can predict the situations that are proportional and might have a hard time predicting the ones that are not. In Lessons 2–4, students use the same three situations to explore proportional relationships. Two of the relationships are proportional and one is not. They look at these situations in tables, equations, and graphs. After Lesson 4, students realize a proportional relationship is represented on a graph as a straight line that passes through the origin. In Lesson 5, they look at straight lines that do not represent a proportional relationship. Lesson 6 focuses on the idea of how a proportion that they solved in sixth grade relates to a proportional relationship. They follow that by looking at rates expressed as fractions, finding the unit rate (the constant of proportionality), and then using the constant of proportionality to solve a problem. In Lesson 8, students fine-tune their definition of proportional relationship by looking at situations and determining if they represent proportional relationships and justifying their reasoning. They then apply what they have learned to a situation about flags and stars and extend that thinking to comparing two prices—examining the equations and the graphs. The Putting It Together lesson has them solve two problems and then critique other student work.
Gallery 1 provides students with additional proportional relationship problems.
The second part of the unit works with percents. First, percents are tied to proportional relationships, and then students examine percent situations as formulas, graphs, and tables. They then move to a new context—salary increase—and see the similarities with sales taxes. Next, students explore percent decrease, and then they analyze inaccurate statements involving percents, explaining why the statements are incorrect. Students end this sequence of lessons with a formative assessment that focuses on percent increase and percent decrease and ties it to decimals.
Students have ample opportunities to check, deepen, and apply their understanding of proportional relationships, including percents, with the selection of problems in Gallery 2.
Students analyze the graph of a proportional relationship in order to find …
Students analyze the graph of a proportional relationship in order to find the approximate constant of proportionality, to write the related formula, and to create a table of values that lie on the graph.Key ConceptsThe constant of proportionality determines the steepness of the straight-line graph that represents a proportional relationship. The steeper the line is, the greater the constant of proportionality.On the graph of a proportional relationship, the constant of proportionality is the constant ratio of y to x, or the slope of the line.A proportional relationship can be represented in different ways: a ratio table, a graph of a straight line through the origin, or an equation of the form y = kx, where k is the constant of proportionality.Goals and Learning ObjectivesIdentify the constant of proportionality from a graph that represents a proportional relationship.Write a formula for a graph that represents a proportional relationship.Make a table for a graph that represents a proportional relationship.Relate the constant of proportionality to the steepness of a graph that represents a proportional relationship (i.e., the steeper the line is, the greater the constant of proportionality).
Students are given 4-5 coordinate points, that will represent the sheep. First, …
Students are given 4-5 coordinate points, that will represent the sheep. First, they are tasked with creating a fence around the sheep. The students will use the endpoints of each piece of fence to compute the slope, y-intercept, domain and equation of the line. They will then code the rover to draw their lines. Finally, the students can calculate the area/perimeter of their fence and calculate the cost to build the fence. The students will then be challenged to minimize the area, perimeter and cost of building their corral, recalculate the equations of their lines, stating their new slope, y-intercept, and domain.
Using the LEGO MINDSTORMS(TM) NXT kit, students construct experiments to measure the …
Using the LEGO MINDSTORMS(TM) NXT kit, students construct experiments to measure the time it takes a free falling body to travel a specified distance. Students use the touch sensor, rotational sensor, and the NXT brick to measure the time of flight for the falling object at different release heights. After the object is released from its holder and travels a specified distance, a touch sensor is triggered and time of object's descent from release to impact at touch sensor is recorded and displayed on the screen of the NXT. Students calculate the average velocity of the falling object from each point of release, and construct a graph of average velocity versus time. They also create a best fit line for the graph using spreadsheet software. Students use the slope of the best fit line to determine their experimental g value and compare this to the standard value of g.
The focus of this unit is to introduce the concepts of force …
The focus of this unit is to introduce the concepts of force and motion. Specifically this unit will address the forces of push, pull, gravity, and work. It also introduces students to the concepts of friction and slope. The unit begins with an introduction to the scientific method and addresses the differences between scientists and engineers. Students will be both scientists and engineers while completing this unit.
In this activity, students will observe marbles rolling down a ramp and …
In this activity, students will observe marbles rolling down a ramp and identify variables that could cause the marble to roll faster or farther. They will then design a procedure to test how the height of the ramp affects the motion of the marble and collect, record, and analyze data.
Khan Academy video proving parallel lines have the same slope. Information text …
Khan Academy video proving parallel lines have the same slope. Information text added mid video, along with a drag and drop of ordering proof steps at the end of the video.
Students explore building a pyramid, learning about the simple machine called an …
Students explore building a pyramid, learning about the simple machine called an inclined plane. They also learn about another simple machine, the screw, and how it is used as a lifting or fastening device. During a hands-on activity, students see how the angle of inclination and pull force can make it easier (or harder) to pull an object up an inclined plane.
No restrictions on your remixing, redistributing, or making derivative works. Give credit to the author, as required.
Your remixing, redistributing, or making derivatives works comes with some restrictions, including how it is shared.
Your redistributing comes with some restrictions. Do not remix or make derivative works.
Most restrictive license type. Prohibits most uses, sharing, and any changes.
Copyrighted materials, available under Fair Use and the TEACH Act for US-based educators, or other custom arrangements. Go to the resource provider to see their individual restrictions.